Springville: Fire Incidents, Utah (UT)
Where are fire incidents reported in Springville, UT
Something went wrong! Please refresh the page.
|
| |||||||||||||||||||||||||||||||||||||||||||||||||||||||||||||||||||||||||||||||||||||||||||||||||||||||||||||
| Other | 252 | |||||||||||||||||||||||||||||||||||||||||||||||||||||||||||||||||||||||||||||||||||||||||||||||||||||||||||||
2002 - 2018 National Fire Incident Reporting System (NFIRS) incidents
- Incident types reported to NFIRS in Springville, UT
- 1,66849.9%Rescue & EMS
- 57617.2%Fire
- 3309.9%Hazardous Condition
- 3159.4%False Alarm
- 2908.7%Good Intent Call
- 1364.1%Service Call
- 200.6%Special Incident
- 60.2%Overpressure Rupture
- 40.1%Severe Weather
- Fire incident types reported to NFIRS in Springville, UT
- 19033.0%Structure Fires
- 17931.1%Outside Fires
- 10718.6%Mobile Property/Vehicle Fires
- 10017.4%Other
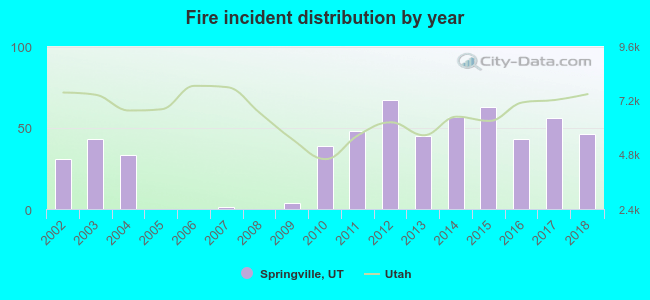 Based on the data from the years 2002 - 2018 the average number of fire incidents per year is 34. The highest number of fire incidents - 67 took place in 2012, and the least - 0 in 2005. The data has an increasing trend.
The average number of yearly fire incidents per 10k residents in Springville, UT compared to nearest cities:
(Note: Based on data for the last 3 years, including only cities with population 5,000 and above)
| Springville: | 15.4 |
| Mapleton: | 7.3 |
| Spanish Fork: | 15.4 |
| Provo: | 14.6 |
| Salem: | 27.2 |
| Orem: | 14.5 |
| Payson: | 36.7 |
| Lindon: | 20.8 |
| Pleasant Grove: | 12.9 |
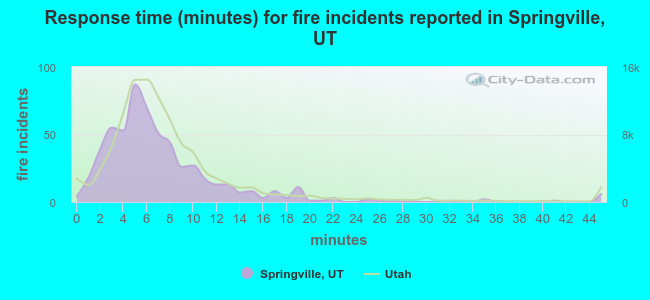 The median response time based on all reported fire incidents is 6 minutes. This is about the same as the Utah median value.
The median response time in Springville, UT compared to nearest cities:
(Note: Based on data for all years, including only cities with at least 500 fire incidents)
| Springville: | 6 minutes |
| Spanish Fork: | 8 minutes |
| Provo: | 6 minutes |
| Orem: | 5 minutes |
| Payson: | 8 minutes |
| Pleasant Grove: | 6 minutes |
| American Fork: | 7 minutes |
| Lehi: | 7 minutes |
| Eagle Mountain: | 9 minutes |
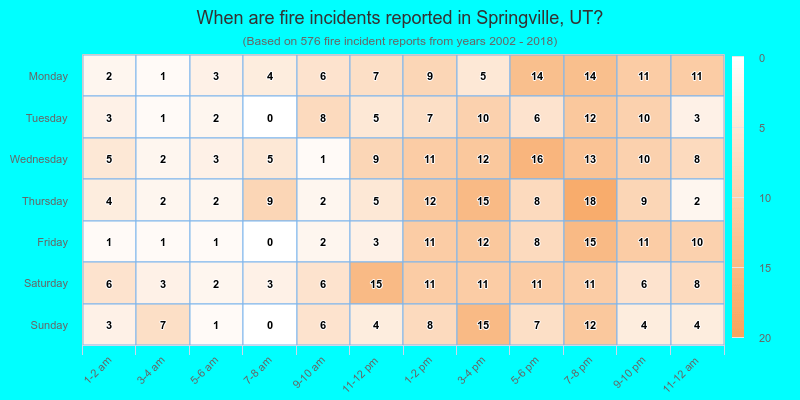
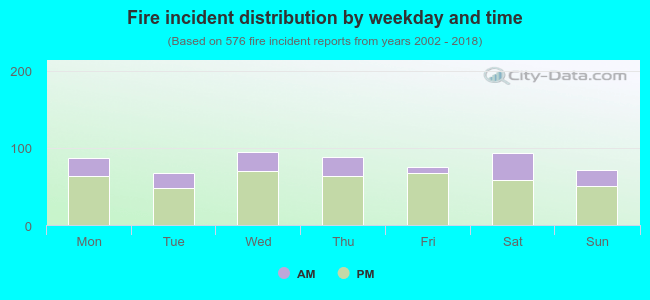 26.9% incidents where reported in the morning and 73.1% in the evening. The most fires (16.5%) took place on Wednesday, and the least (11.6%) on Tuesday.
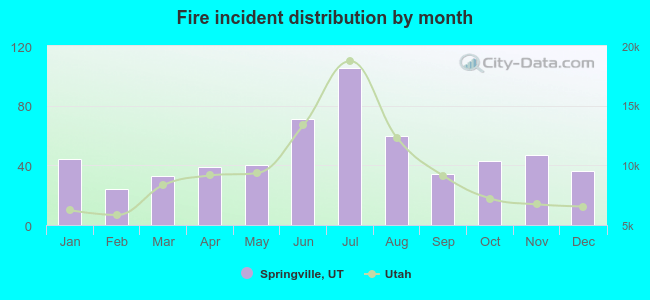 According to the 576 reports from years 2002 - 2018 most fires (18.2%) took place during July, and the least (4.2%) in February.
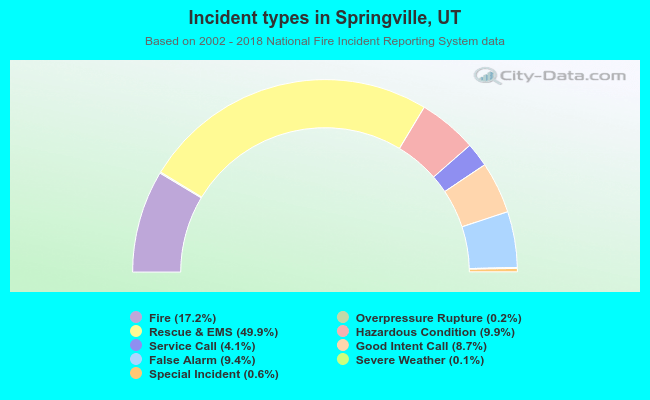 Out of all 3,345 cases reported during the years 2002 - 2018, the most belonged to the categories: Rescue & EMS (49.9%), Fire (17.2%), and Hazardous Condition (9.9%).
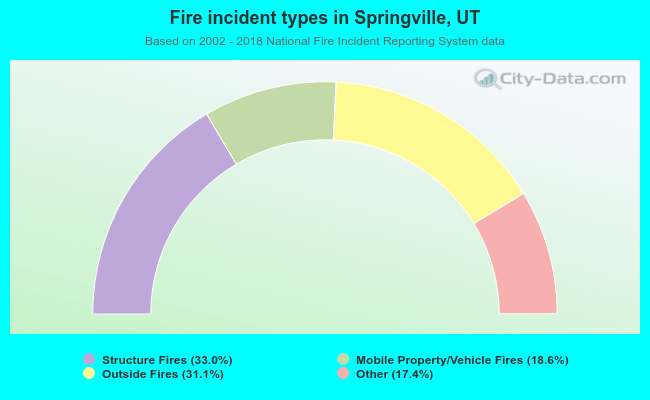 When looking into fire subcategories, the most reports belonged to: Structure Fires (33.0%), and Outside Fires (31.1%).