Richton Park: Fire Incidents, Illinois (IL)
Where are fire incidents reported in Richton Park, IL
Something went wrong! Please refresh the page.
| Fire incidents reported | |
|---|---|
| Sreet name | Count |
| SAUK TRAIL | 150 |
| GOVERNORS HWY | 80 |
| IMPERIAL DR | 66 |
| CHURCHILL DR | 44 |
| RIDGEWAY AVE | 42 |
| BUTTERFIELD | 38 |
| CICERO AVE | 36 |
| HEARTLAND DR | 36 |
| TOWER DR | 36 |
| CEDAR RIDGE LN | 32 |
| TOWER | 30 |
| REGENCY DR | 26 |
| CANTERBURY CT | 24 |
| CEDAR RIDGE | 24 |
| EAST DR | 24 |
| HEARTLAND | 24 |
| MILLARD AVE | 24 |
| BELMONT RD | 22 |
| EUCLID | 22 |
| IMPERIAL | 22 |
| STEGER RD | 22 |
| FARMINGTON AVE | 20 |
| RICHTON RD | 20 |
| THOMAS DR | 20 |
| BUTTERFIELD RD | 18 |
| I57 HWY | 18 |
| RICHTON SQUARE RD | 18 |
| RIDGEWAY | 18 |
| JACKSON | 16 |
| LAWNDALE AVE | 16 |
2002 - 2018 National Fire Incident Reporting System (NFIRS) incidents
- Incident types reported to NFIRS in Richton Park, IL
- 8,26165.5%Rescue & EMS
- 1,35010.7%False Alarm
- 9767.7%Fire
- 8526.8%Hazardous Condition
- 6224.9%Service Call
- 5284.2%Good Intent Call
- Fire incident types reported to NFIRS in Richton Park, IL
- 64065.6%Structure Fires
- 15916.3%Outside Fires
- 11111.4%Mobile Property/Vehicle Fires
- 666.8%Other
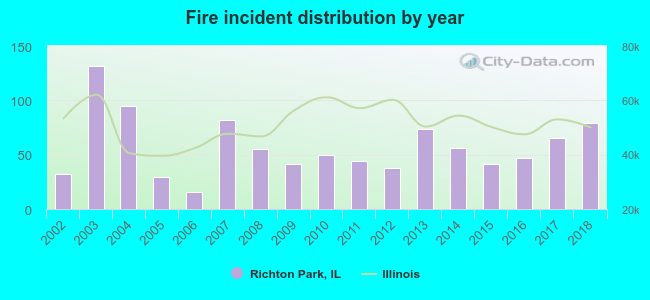 Based on the data from the years 2002 - 2018 the average number of fires per year is 57. The highest number of reported fire incidents - 132 took place in 2003, and the least - 16 in 2006. The data has a growing trend.
The average number of yearly fire incidents per 10k residents in Richton Park, IL compared to nearest cities:
(Note: Based on data for the last 3 years, including only cities with population 5,000 and above)
| Richton Park: | 46.3 |
| Park Forest: | 45.2 |
| Matteson: | 55.2 |
| Olympia Fields: | 19.8 |
| University Park: | 72.8 |
| Monee: | 131.9 |
| Flossmoor: | 55.0 |
| Chicago Heights: | 29.5 |
| Steger: | 37.3 |
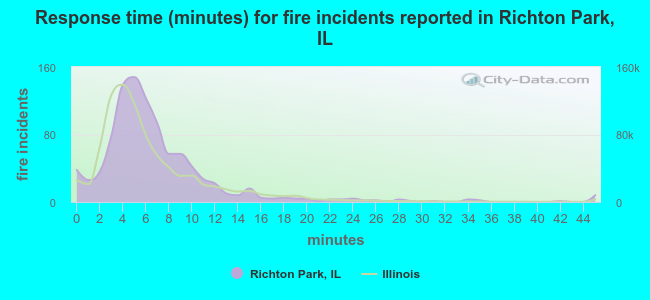 The median response time based on all reported fire incidents is 6 minutes. This is close to the state median value.
The median response time in Richton Park, IL compared to nearest cities:
(Note: Based on data for all years, including only cities with at least 500 fire incidents)
| Richton Park: | 6 minutes |
| Park Forest: | 5 minutes |
| Matteson: | 6 minutes |
| University Park: | 6 minutes |
| Monee: | 6 minutes |
| Flossmoor: | 6 minutes |
| Chicago Heights: | 4 minutes |
| Steger: | 5 minutes |
| Country Club Hills: | 5 minutes |
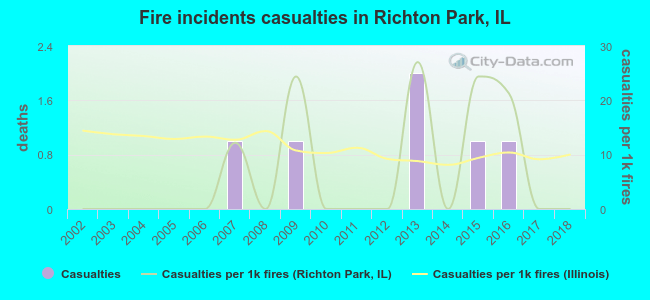 According to the reports from the years 2002 - 2018 the average number of fire-related yearly casualties is 0. The highest number of injuries - 2 took place in 2013, and the lowest - 0 in 2002. The data has a constant trend.
The average number of casualties per 1,000 fire incidents is 6. This indicator was the highest - 27 in 2013, and the lowest 0 in 2002. The trend for casualties per 1,000 fire incidents is constant. Compared to the Illinois value the number of casualties per 1,000 fire incidents is lower.
According to the reports from the years 2002 - 2018 the average number of fire-related yearly casualties is 0. The highest number of injuries - 2 took place in 2013, and the lowest - 0 in 2002. The data has a constant trend.
The average number of casualties per 1,000 fire incidents is 6. This indicator was the highest - 27 in 2013, and the lowest 0 in 2002. The trend for casualties per 1,000 fire incidents is constant. Compared to the Illinois value the number of casualties per 1,000 fire incidents is lower.Casualties per 1,000 incidents in Richton Park, IL compared to nearest cities:
(Note: Based on data for all years, including only cities with at least 500 fire incidents)
| Richton Park: | 6.1 |
| Park Forest: | 37.5 |
| Matteson: | 21.6 |
| University Park: | 8.1 |
| Monee: | 3.9 |
| Flossmoor: | 17.8 |
| Chicago Heights: | 9.6 |
| Steger: | 6.8 |
| Country Club Hills: | 6.0 |
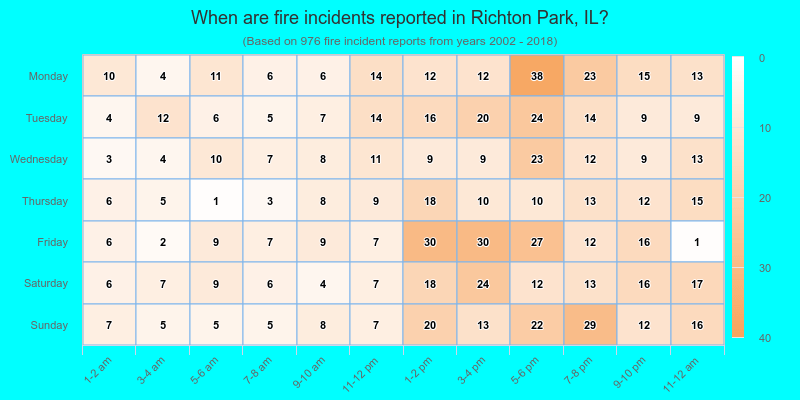
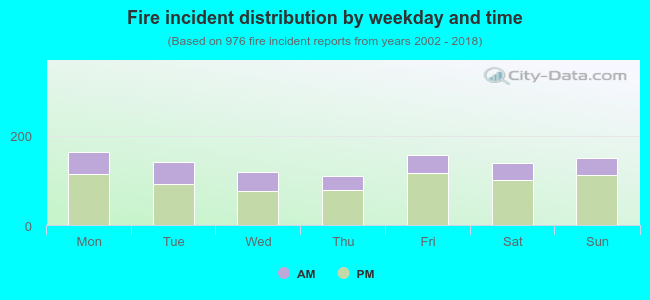 29.7% incidents where reported in the morning and 70.3% in the evening. The most fires (16.8%) took place on Monday, and the least (11.3%) on Thursday.
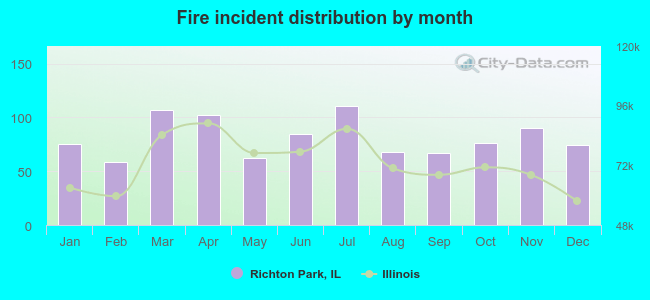 Based on the 976 reports from years 2002 - 2018 most fires (11.4%) took place during July, and the least (6.0%) in February.
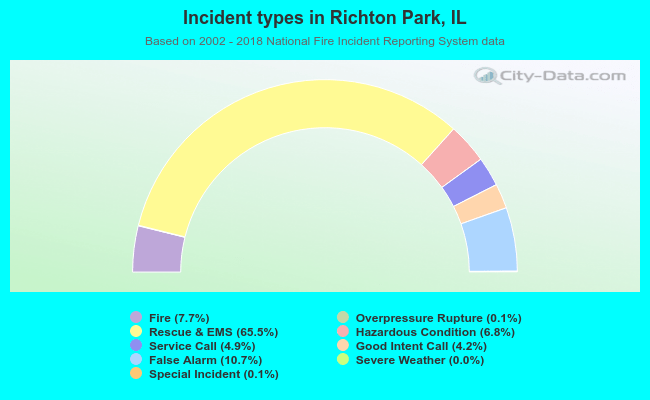 Out of all 12,612 cases reported during the years 2002 - 2018, the most belonged to the categories: Rescue & EMS (65.5%), False Alarm (10.7%), and Fire (7.7%).
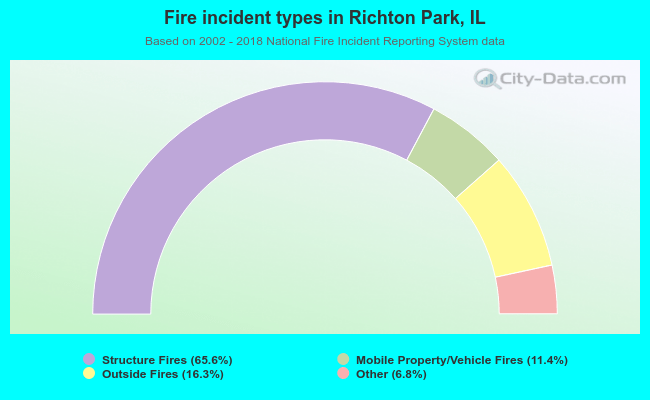 When looking into fire subcategories, the most reports belonged to: Structure Fires (65.6%), and Outside Fires (16.3%).