Matteson: Fire Incidents, Illinois (IL)
Where are fire incidents reported in Matteson, IL
Something went wrong! Please refresh the page.
| Fire incidents reported | |
|---|---|
| Sreet name | Count |
| 211TH ST | 310 |
| CICERO AVE | 130 |
| CENTRAL AVE | 118 |
| VOLLMER RD | 72 |
| LINDENWOOD DR | 62 |
| COX AVE | 58 |
| MAIN ST | 56 |
| CHARLESTON RD | 54 |
| I57 HWY | 44 |
| WILLOW RD | 38 |
| 216TH ST | 34 |
| KILDARE AVE | 32 |
| LINCOLN MALL | 32 |
| RICHTON RD | 32 |
| HARLEM AVE | 30 |
| BRIARWOOD CT | 28 |
| LINCOLN MALL DR | 28 |
| OAKWOOD LN | 28 |
| OAKWOOD | 26 |
| SOUTHWICK DR | 26 |
| 211TH | 24 |
| 214TH PL | 24 |
| ALLEMONG DR | 24 |
| CHURN | 24 |
| NOTRE DAME DR | 24 |
| WEDGEWOOD RD | 24 |
| I57 | 22 |
| LINDENWOOD | 22 |
| ROSE LN | 22 |
| 213TH PL | 20 |
| Other | 104 |
2002 - 2018 National Fire Incident Reporting System (NFIRS) incidents
- Incident types reported to NFIRS in Matteson, IL
- 12,45353.5%Rescue & EMS
- 4,67620.1%False Alarm
- 2,0869.0%Service Call
- 1,5726.8%Fire
- 1,3315.7%Hazardous Condition
- 1,1354.9%Good Intent Call
- Fire incident types reported to NFIRS in Matteson, IL
- 85554.4%Structure Fires
- 35022.3%Outside Fires
- 32220.5%Mobile Property/Vehicle Fires
- 452.9%Other
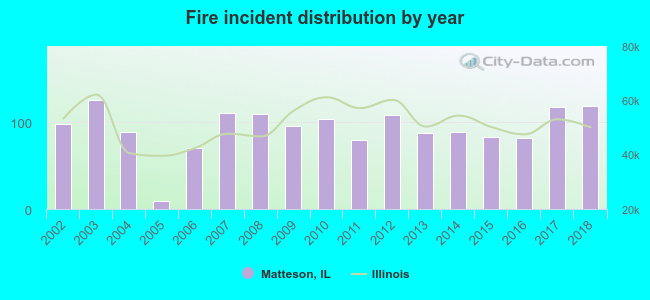 Based on the data from the years 2002 - 2018 the average number of fire incidents per year is 92. The highest number of reported fire incidents - 125 took place in 2003, and the least - 9 in 2005. The data has an increasing trend.
The average number of yearly fire incidents per 10k residents in Matteson, IL compared to nearest cities:
(Note: Based on data for the last 3 years, including only cities with population 5,000 and above)
| Matteson: | 55.2 |
| Richton Park: | 46.3 |
| Olympia Fields: | 19.8 |
| Park Forest: | 45.2 |
| Flossmoor: | 55.0 |
| Country Club Hills: | 63.0 |
| Chicago Heights: | 29.5 |
| Hazel Crest: | 57.3 |
| Homewood: | 44.9 |
 The median response time based on all reported fire incidents is 6 minutes. This is similar to the Illinois median value.
The median response time in Matteson, IL compared to nearest cities:
(Note: Based on data for all years, including only cities with at least 500 fire incidents)
| Matteson: | 6 minutes |
| Richton Park: | 6 minutes |
| Park Forest: | 5 minutes |
| Flossmoor: | 6 minutes |
| Country Club Hills: | 5 minutes |
| Chicago Heights: | 4 minutes |
| Hazel Crest: | 5 minutes |
| Homewood: | 5 minutes |
| University Park: | 6 minutes |
 According to the data from the years 2002 - 2018 the average number of fire-related yearly deaths is 0. The highest number of reported deaths - 3 took place in 2003, and the lowest - 0 in 2002. The data has a rising trend.
 Based on the data from the years 2002 - 2018 the average number of fire-related yearly casualties is 2. The highest number of reported injuries - 4 took place in 2006, and the lowest - 0 in 2004. The data has a rising trend.
The average number of casualties per 1,000 fire incidents is 21. This indicator was the highest - 57 in 2006, and the lowest 0 in 2004. The trend for casualties per 1,000 fire incidents is growing. Compared to the Illinois value the number of casualties per 1,000 incidents is higher.
Based on the data from the years 2002 - 2018 the average number of fire-related yearly casualties is 2. The highest number of reported injuries - 4 took place in 2006, and the lowest - 0 in 2004. The data has a rising trend.
The average number of casualties per 1,000 fire incidents is 21. This indicator was the highest - 57 in 2006, and the lowest 0 in 2004. The trend for casualties per 1,000 fire incidents is growing. Compared to the Illinois value the number of casualties per 1,000 incidents is higher.Casualties per 1,000 incidents in Matteson, IL compared to nearest cities:
(Note: Based on data for all years, including only cities with at least 500 fire incidents)
| Matteson: | 21.6 |
| Richton Park: | 6.1 |
| Park Forest: | 37.5 |
| Flossmoor: | 17.8 |
| Country Club Hills: | 6.0 |
| Chicago Heights: | 9.6 |
| Hazel Crest: | 11.5 |
| Homewood: | 19.1 |
| University Park: | 8.1 |
 32.7% incidents where reported in the morning and 67.3% in the evening. The most fires (16.0%) took place on Monday, and the least (12.2%) on Wednesday.
 According to the 1,572 reports from years 2002 - 2018 most fires (10.7%) took place during July, and the least (6.5%) in November.
 Out of all 23,277 cases reported during the years 2002 - 2018, the most belonged to the categories: Rescue & EMS (53.5%), False Alarm (20.1%), and Service Call (9.0%).
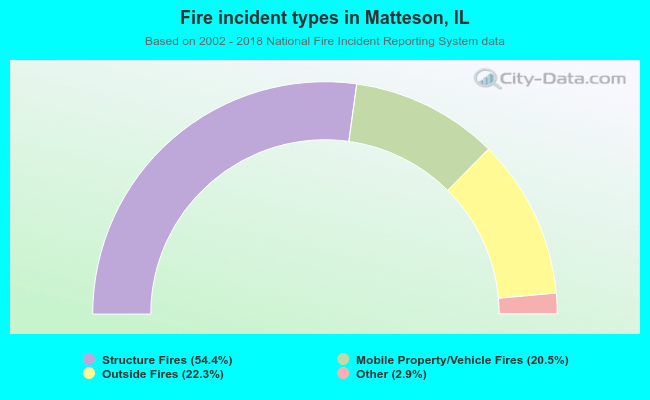 When looking into fire subcategories, the most reports belonged to: Structure Fires (54.4%), and Outside Fires (22.3%).