Ridgefield: Fire Incidents, Washington (WA)
Where are fire incidents reported in Ridgefield, WA
Something went wrong! Please refresh the page.
|
| |||||||||||||||||||||||||||||||||||||||||||||||||||||||||||||||||||||||||||||||||||||||||||||||||||||||||||||
2002 - 2018 National Fire Incident Reporting System (NFIRS) incidents
- Incident types reported to NFIRS in Ridgefield, WA
- 3,08247.1%Rescue & EMS
- 1,55723.8%Good Intent Call
- 1,01115.5%Fire
- 3194.9%Service Call
- 2834.3%Hazardous Condition
- 2664.1%False Alarm
- 140.2%Special Incident
- Fire incident types reported to NFIRS in Ridgefield, WA
- 44544.0%Outside Fires
- 25024.7%Structure Fires
- 23523.2%Mobile Property/Vehicle Fires
- 818.0%Other
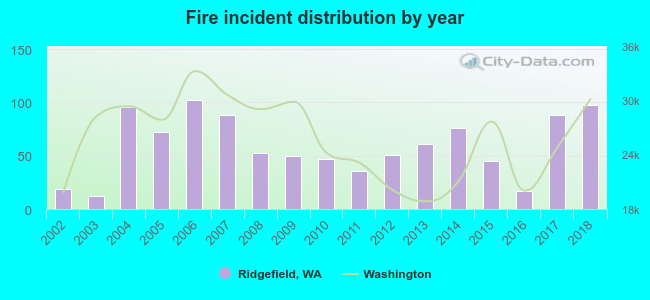 According to the data from the years 2002 - 2018 the average number of fires per year is 59. The highest number of fires - 102 took place in 2006, and the least - 12 in 2003. The data has a growing trend.
The average number of yearly fire incidents per 10k residents in Ridgefield, WA compared to nearest cities:
(Note: Based on data for the last 3 years, including only cities with population 5,000 and above)
| Ridgefield: | 110.5 |
| Woodland: | 66.0 |
| Battle Ground: | 61.6 |
| Hazel Dell: | 4.1 |
| Vancouver: | 40.5 |
| Camas: | 32.8 |
| Kelso: | 126.7 |
| Rose Valley: | 4.0 |
| Washougal: | 45.1 |
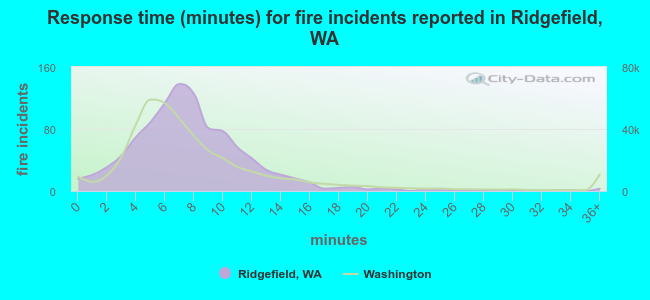 The median response time based on all reported fire incidents is 7 minutes. This is comparable to the state median value.
The median response time in Ridgefield, WA compared to nearest cities:
(Note: Based on data for all years, including only cities with at least 500 fire incidents)
| Ridgefield: | 7 minutes |
| Woodland: | 7 minutes |
| Scappoose: | 8 minutes |
| Battle Ground: | 6 minutes |
| Brush Prairie: | 7 minutes |
| Vancouver: | 6 minutes |
| Portland: | 5 minutes |
| Camas: | 7 minutes |
| Hillsboro: | 5 minutes |
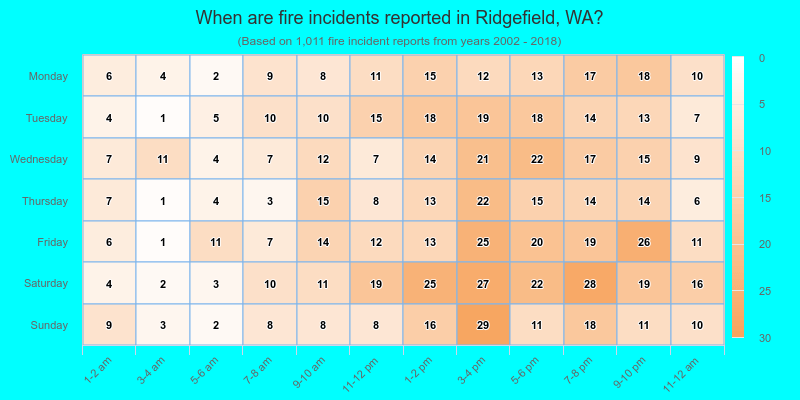
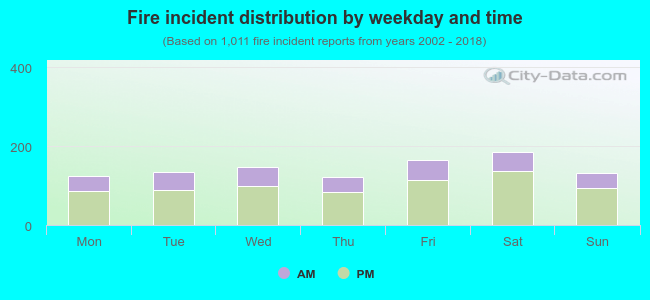 30.6% incidents where reported in the morning and 69.4% in the evening. The most fires (18.4%) took place on Saturday, and the least (12.1%) on Thursday.
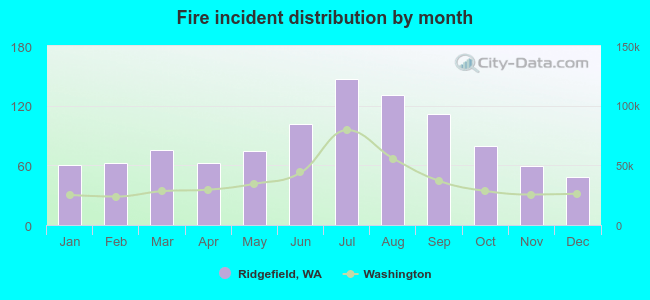 According to the 1,011 reports from years 2002 - 2018 most fires (14.5%) took place during July, and the least (4.7%) in December.
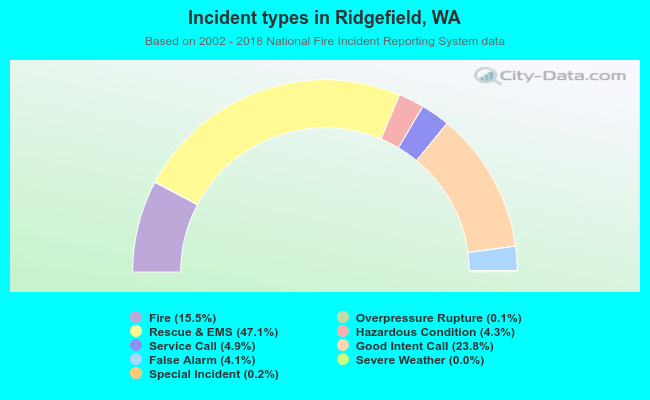 Out of all 6,538 cases reported during the years 2002 - 2018, the most belonged to the categories: Rescue & EMS (47.1%), Good Intent Call (23.8%), and Fire (15.5%).
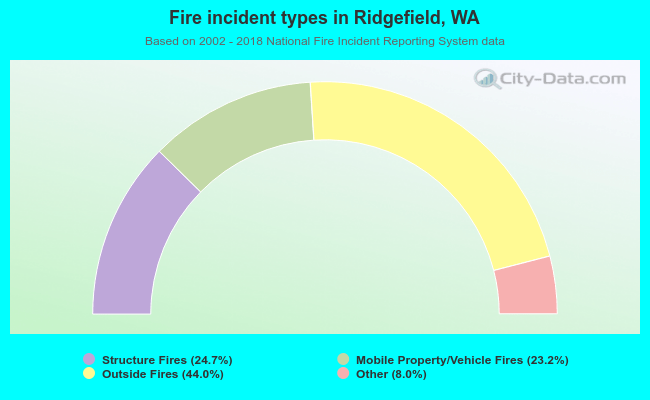 When looking into fire subcategories, the most reports belonged to: Outside Fires (44.0%), and Structure Fires (24.7%).