Woodland: Fire Incidents, Washington (WA)
Where are fire incidents reported in Woodland, WA
Something went wrong! Please refresh the page.
|
| |||||||||||||||||||||||||||||||||||||||||||||||||||||||||||||||||||||||||||||||||||||||||||||||||||||||||||||
2002 - 2018 National Fire Incident Reporting System (NFIRS) incidents
- Incident types reported to NFIRS in Woodland, WA
- 3,59455.0%Rescue & EMS
- 1,05116.1%Fire
- 83412.8%Good Intent Call
- 4156.4%Hazardous Condition
- 3755.7%Service Call
- 2373.6%False Alarm
- 200.3%Special Incident
- Fire incident types reported to NFIRS in Woodland, WA
- 49447.0%Outside Fires
- 28326.9%Structure Fires
- 21020.0%Mobile Property/Vehicle Fires
- 646.1%Other
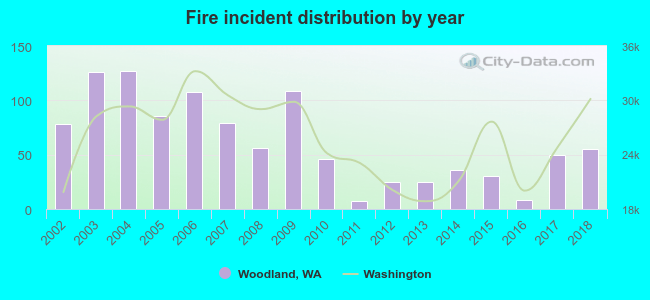 According to the data from the years 2002 - 2018 the average number of fires per year is 62. The highest number of fires - 127 took place in 2004, and the least - 7 in 2011. The data has a declining trend.
The average number of yearly fire incidents per 10k residents in Woodland, WA compared to nearest cities:
(Note: Based on data for the last 3 years, including only cities with population 5,000 and above)
| Woodland: | 66.0 |
| Ridgefield: | 110.5 |
| Battle Ground: | 61.6 |
| Hazel Dell: | 4.1 |
| Rose Valley: | 4.0 |
| Kelso: | 126.7 |
| Longview: | 67.3 |
| Vancouver: | 40.5 |
| Camas: | 32.8 |
 The median response time based on all reported fire incidents is 7 minutes. This is comparable to the Washington median value.
The median response time in Woodland, WA compared to nearest cities:
(Note: Based on data for all years, including only cities with at least 500 fire incidents)
| Woodland: | 7 minutes |
| Ridgefield: | 7 minutes |
| Scappoose: | 8 minutes |
| Battle Ground: | 6 minutes |
| Brush Prairie: | 7 minutes |
| Kelso: | 7 minutes |
| Longview: | 5 minutes |
| Vancouver: | 6 minutes |
| Castle Rock: | 9 minutes |
 30.7% incidents where reported in the morning and 69.3% in the evening. The most fires (15.3%) took place on Sunday, and the least (13.8%) on Monday.
 According to the 1,051 fire incidents from years 2002 - 2018 most fires (19.3%) took place during July, and the least (4.5%) in May.
 Out of all 6,531 cases reported during the years 2002 - 2018, the most belonged to the categories: Rescue & EMS (55.0%), Fire (16.1%), and Good Intent Call (12.8%).
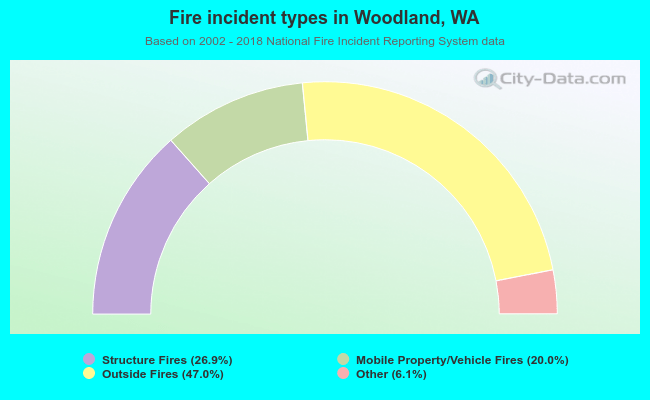 When looking into fire subcategories, the most incidents belonged to: Outside Fires (47.0%), and Structure Fires (26.9%).