Rittman: Fire Incidents, Ohio (OH)
Where are fire incidents reported in Rittman, OH
Something went wrong! Please refresh the page.
|
| |||||||||||||||||||||||||||||||||||||||||||||||||||||||||||||||||||||||||||||||||||||||||||||||||||||||||||||
2002 - 2018 National Fire Incident Reporting System (NFIRS) incidents
- Incident types reported to NFIRS in Rittman, OH
- 38326.2%Rescue & EMS
- 34523.6%Fire
- 28319.4%Service Call
- 23616.2%Hazardous Condition
- 1087.4%False Alarm
- 876.0%Good Intent Call
- 120.8%Severe Weather
- 40.3%Special Incident
- 30.2%Overpressure Rupture
- Fire incident types reported to NFIRS in Rittman, OH
- 18453.3%Structure Fires
- 11332.8%Outside Fires
- 4412.8%Mobile Property/Vehicle Fires
- 41.2%Other
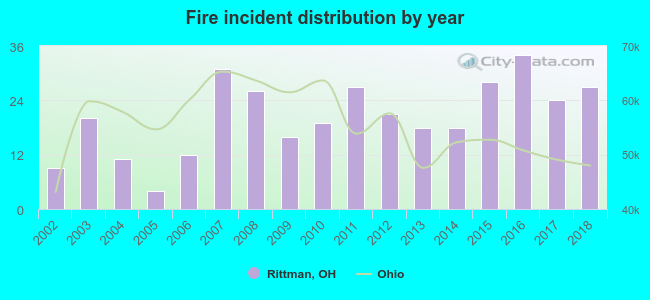 Based on the data from the years 2002 - 2018 the average number of fire incidents per year is 20. The highest number of fire incidents - 34 took place in 2016, and the least - 4 in 2005. The data has a growing trend.
The average number of yearly fire incidents per 10k residents in Rittman, OH compared to nearest cities:
(Note: Based on data for the last 3 years, including only cities with population 5,000 and above)
| Rittman: | 43.2 |
| Wadsworth: | 30.6 |
| Norton: | 30.4 |
| Orrville: | 74.5 |
| Barberton: | 18.0 |
| Canal Fulton: | 32.8 |
| Medina: | 50.5 |
| Fairlawn: | 48.5 |
| Wooster: | 43.3 |

 According to the reports from the years 2002 - 2018 the average number of fire-related casualties per year is 0. The highest number of casualties - 1 took place in 2002, and the lowest - 0 in 2003. The data has a decreasing trend.
 33.3% incidents where reported in the morning and 66.7% in the evening. The most fires (15.9%) took place on Monday, and the least (11.0%) on Friday.
 Based on the 345 incident reports from years 2002 - 2018 most fires (13.0%) took place during April, and the least (5.5%) in February.
 Out of all 1,461 cases reported during the years 2002 - 2018, the most belonged to the categories: Rescue & EMS (26.2%), Fire (23.6%), and Service Call (19.4%).
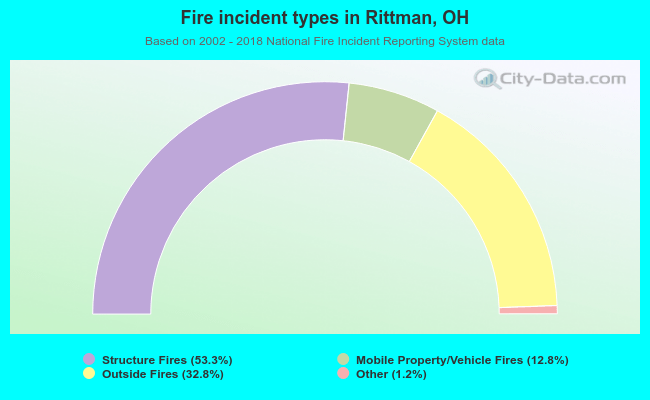 When looking into fire subcategories, the most reports belonged to: Structure Fires (53.3%), and Outside Fires (32.8%).