Wadsworth: Fire Incidents, Ohio (OH)
Where are fire incidents reported in Wadsworth, OH
Something went wrong! Please refresh the page.
| Fire incidents reported | |
|---|---|
| Sreet name | Count |
| MAIN ST | 70 |
| HIGHSR 94 ST | 46 |
| RIDGE RD | 46 |
| RIDGEWOOD RD | 46 |
| BEACH RD | 34 |
| FIRST ST | 34 |
| SEVILLE RD | 32 |
| BROAD ST | 30 |
| MEDINA LINE RD | 30 |
| GREAT OAKS TRL | 28 |
| HIGH ST | 28 |
| SMOKERISE DR | 28 |
| SHARON COPLEY RD | 26 |
| HIGHLAND AVE | 24 |
| BERGEY ST | 22 |
| COLLEGE ST | 22 |
| FIXLER RD | 22 |
| HARTMAN RD | 22 |
| MT. EATON RD. | 22 |
| WEBER DR | 22 |
| BONETA RD | 18 |
| HIGH (SR 94) ST | 18 |
| LYMAN ST | 18 |
| S MEDINA LINE RD | 18 |
| HIGH ST. | 16 |
| PIFER RD | 16 |
| AKRON RD. | 14 |
| CHESTNUT ST | 14 |
| HATCH RD | 14 |
| HIGH STREET SR 94 | 14 |
| Other | 416 |
2002 - 2018 National Fire Incident Reporting System (NFIRS) incidents
- Incident types reported to NFIRS in Wadsworth, OH
- 4,91959.2%Rescue & EMS
- 1,21014.6%Fire
- 7438.9%Service Call
- 5576.7%False Alarm
- 4495.4%Hazardous Condition
- 4074.9%Good Intent Call
- 130.2%Overpressure Rupture
- Fire incident types reported to NFIRS in Wadsworth, OH
- 60149.7%Structure Fires
- 41734.5%Outside Fires
- 17914.8%Mobile Property/Vehicle Fires
- 131.1%Other
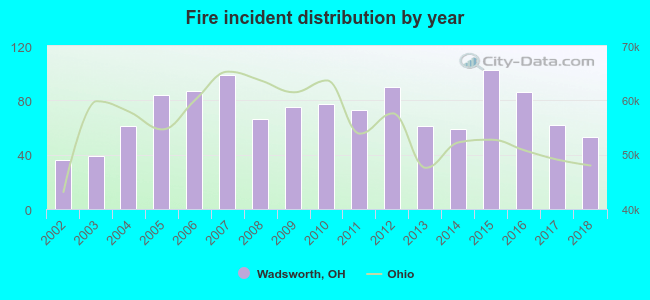 Based on the data from the years 2002 - 2018 the average number of fire incidents per year is 71. The highest number of fires - 102 took place in 2015, and the least - 36 in 2002. The data has a rising trend.
The average number of yearly fire incidents per 10k residents in Wadsworth, OH compared to nearest cities:
(Note: Based on data for the last 3 years, including only cities with population 5,000 and above)
| Wadsworth: | 30.6 |
| Norton: | 30.4 |
| Rittman: | 43.2 |
| Barberton: | 18.0 |
| Fairlawn: | 48.5 |
| Medina: | 50.5 |
| Akron: | 43.8 |
| Canal Fulton: | 32.8 |
| Orrville: | 74.5 |
 The median response time based on all reported fire incidents is 6 minutes. This is close to the state median value.
The median response time in Wadsworth, OH compared to nearest cities:
(Note: Based on data for all years, including only cities with at least 500 fire incidents)
| Wadsworth: | 6 minutes |
| Norton: | 7 minutes |
| Barberton: | 4 minutes |
| Fairlawn: | 4 minutes |
| Medina: | 10 minutes |
| Akron: | 5 minutes |
| Canal Fulton: | 8 minutes |
| Orrville: | 6 minutes |
| Cuyahoga Falls: | 4 minutes |
 According to the data from the years 2002 - 2018 the average number of fire-related yearly casualties is 1. The highest number of injuries - 3 took place in 2003, and the lowest - 0 in 2004. The data has a declining trend.
The average number of casualties per 1,000 fire incidents is 21. This indicator was the highest - 77 in 2003, and the lowest 0 in 2004. The trend for casualties per 1,000 fires is decreasing. Compared to the state value the number of casualties per 1,000 fires is higher.
According to the data from the years 2002 - 2018 the average number of fire-related yearly casualties is 1. The highest number of injuries - 3 took place in 2003, and the lowest - 0 in 2004. The data has a declining trend.
The average number of casualties per 1,000 fire incidents is 21. This indicator was the highest - 77 in 2003, and the lowest 0 in 2004. The trend for casualties per 1,000 fires is decreasing. Compared to the state value the number of casualties per 1,000 fires is higher.Casualties per 1,000 incidents in Wadsworth, OH compared to nearest cities:
(Note: Based on data for all years, including only cities with at least 500 fire incidents)
| Wadsworth: | 17.4 |
| Norton: | 10.3 |
| Barberton: | 38.0 |
| Fairlawn: | 11.0 |
| Medina: | 22.5 |
| Akron: | 35.0 |
| Canal Fulton: | 5.5 |
| Orrville: | 18.8 |
| Cuyahoga Falls: | 41.0 |
 29.7% incidents where reported in the morning and 70.3% in the evening. The most fires (15.5%) took place on Monday, and the least (10.7%) on Thursday.
 According to the 1,210 fire incident reports from years 2002 - 2018 most fires (12.0%) took place during April, and the least (5.2%) in September.
 Out of all 8,312 cases reported during the years 2002 - 2018, the most belonged to the categories: Rescue & EMS (59.2%), Fire (14.6%), and Service Call (8.9%).
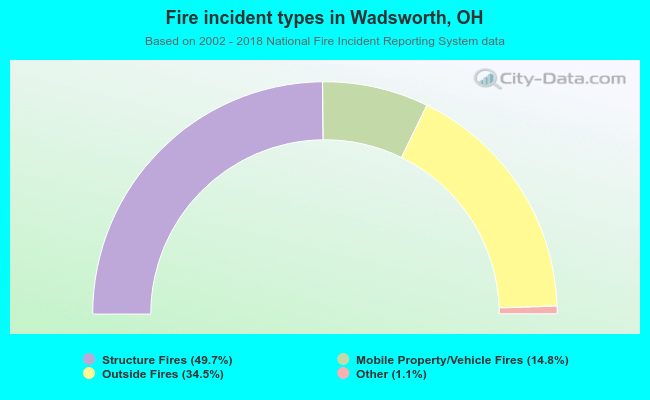 When looking into fire subcategories, the most reports belonged to: Structure Fires (49.7%), and Outside Fires (34.5%).