Riverdale: Fire Incidents, Utah (UT)
Where are fire incidents reported in Riverdale, UT
Something went wrong! Please refresh the page.
|
| |||||||||||||||||||||||||||||||||||||||||||||||||||||||||||||||||||||||||||||||||||||||||||||||||||||||||||||
2002 - 2018 National Fire Incident Reporting System (NFIRS) incidents
- Incident types reported to NFIRS in Riverdale, UT
- 3,07855.9%Rescue & EMS
- 1,27123.1%Good Intent Call
- 5239.5%Fire
- 3997.2%Hazardous Condition
- 1412.6%False Alarm
- 971.8%Service Call
- Fire incident types reported to NFIRS in Riverdale, UT
- 20238.6%Outside Fires
- 15128.9%Structure Fires
- 11722.4%Other
- 5310.1%Mobile Property/Vehicle Fires
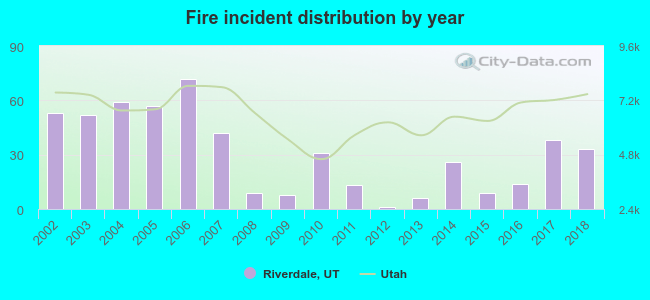 Based on the data from the years 2002 - 2018 the average number of fires per year is 31. The highest number of fires - 72 took place in 2006, and the least - 1 in 2012. The data has a dropping trend.
The average number of yearly fire incidents per 10k residents in Riverdale, UT compared to nearest cities:
(Note: Based on data for the last 3 years, including only cities with population 5,000 and above)
| Riverdale: | 33.0 |
| Washington Terrace: | 1.1 |
| Roy: | 20.1 |
| South Ogden: | 21.4 |
| Sunset: | 30.4 |
| West Haven: | 40.6 |
| Clinton: | 20.5 |
| Ogden: | 35.9 |
| South Weber: | 12.4 |
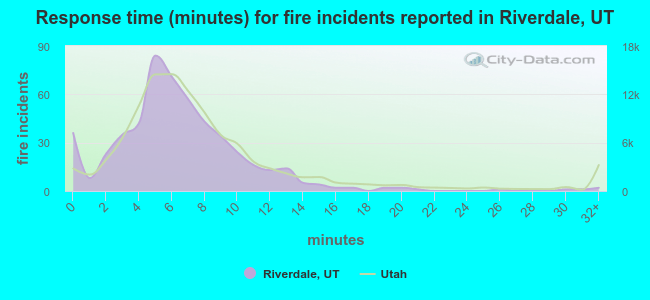 The median response time based on all reported fire incidents is 6 minutes. This is similar to the state median value.
The median response time in Riverdale, UT compared to nearest cities:
(Note: Based on data for all years, including only cities with at least 500 fire incidents)
| Riverdale: | 6 minutes |
| Roy: | 6 minutes |
| West Haven: | 7 minutes |
| Ogden: | 6 minutes |
| Clearfield: | 6 minutes |
| Syracuse: | 6 minutes |
| Layton: | 6 minutes |
| Kaysville: | 6 minutes |
| Farmington: | 7 minutes |
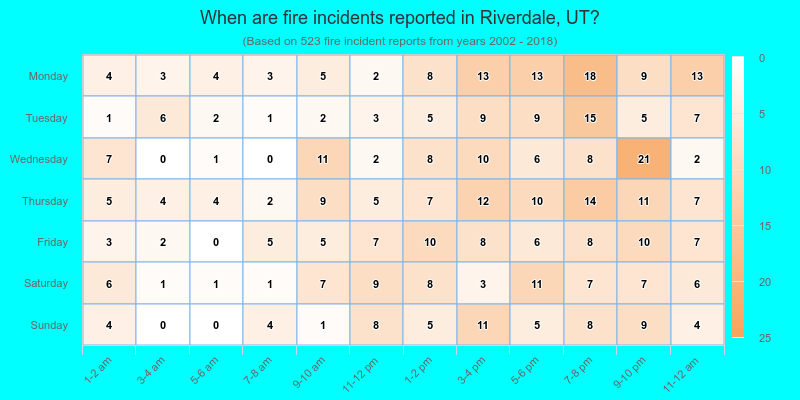
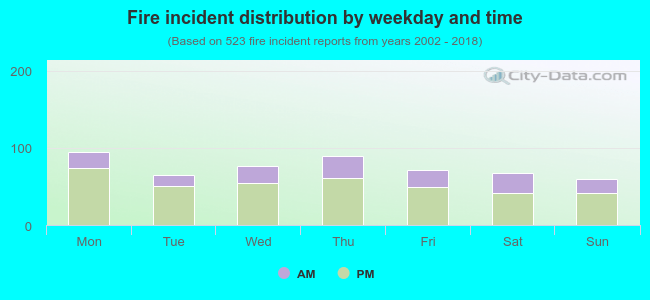 28.7% incidents where reported in the morning and 71.3% in the evening. The most fires (18.2%) took place on Monday, and the least (11.3%) on Sunday.
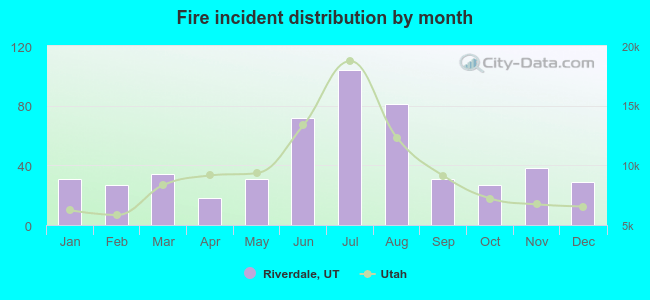 According to the 523 fires from years 2002 - 2018 most fires (19.9%) took place during July, and the least (3.4%) in April.
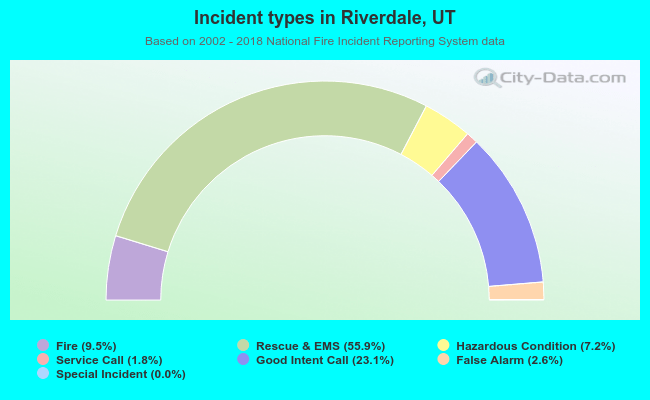 Out of all 5,511 cases reported during the years 2002 - 2018, the most belonged to the categories: Overpressure Rupture (55.9%), Service Call (23.1%), and Fire (9.5%).
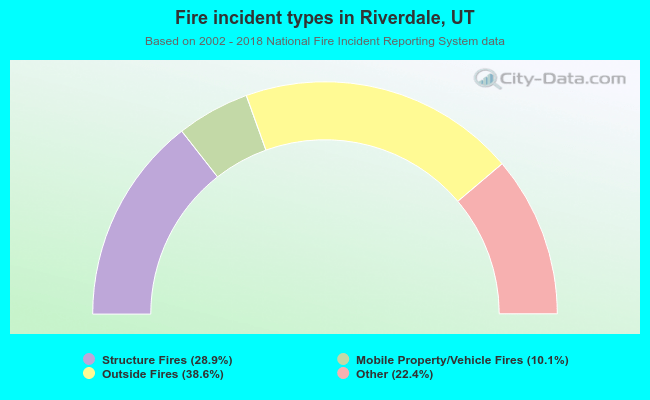 When looking into fire subcategories, the most reports belonged to: Outside Fires (38.6%), and Structure Fires (28.9%).