Syracuse: Fire Incidents, Utah (UT)
Where are fire incidents reported in Syracuse, UT
Something went wrong! Please refresh the page.
|
| |||||||||||||||||||||||||||||||||||||||||||||||||||||||||||||||||||||||||||||||||||||||||||||||||||||||||||||
2002 - 2018 National Fire Incident Reporting System (NFIRS) incidents
- Incident types reported to NFIRS in Syracuse, UT
- 2,32754.0%Rescue & EMS
- 67715.7%Fire
- 49711.5%Hazardous Condition
- 3808.8%Good Intent Call
- 2916.7%False Alarm
- 1242.9%Service Call
- 100.2%Special Incident
- 50.1%Overpressure Rupture
- Fire incident types reported to NFIRS in Syracuse, UT
- 31546.5%Outside Fires
- 25838.1%Structure Fires
- 639.3%Other
- 416.1%Mobile Property/Vehicle Fires
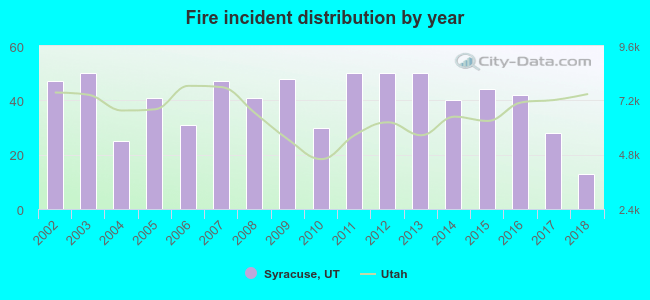 Based on the data from the years 2002 - 2018 the average number of fire incidents per year is 40. The highest number of fire incidents - 50 took place in 2003, and the least - 13 in 2018. The data has a decreasing trend.
The average number of yearly fire incidents per 10k residents in Syracuse, UT compared to nearest cities:
(Note: Based on data for the last 3 years, including only cities with population 5,000 and above)
| Syracuse: | 10.4 |
| Clearfield: | 29.2 |
| West Point: | 23.8 |
| Clinton: | 20.5 |
| Sunset: | 30.4 |
| Layton: | 18.6 |
| Roy: | 20.1 |
| Hooper: | 23.0 |
| Riverdale: | 33.0 |
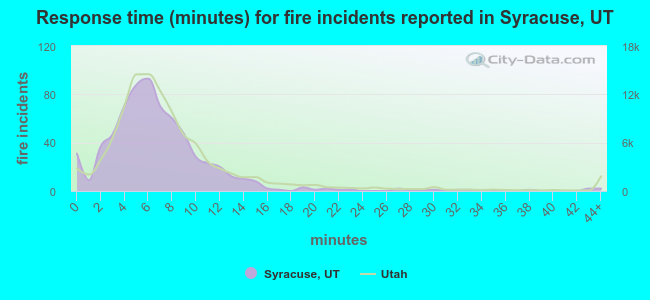 The median response time based on all reported fire incidents is 6 minutes. This is about the same as the Utah median value.
The median response time in Syracuse, UT compared to nearest cities:
(Note: Based on data for all years, including only cities with at least 500 fire incidents)
| Syracuse: | 6 minutes |
| Clearfield: | 6 minutes |
| Layton: | 6 minutes |
| Roy: | 6 minutes |
| Riverdale: | 6 minutes |
| Kaysville: | 6 minutes |
| West Haven: | 7 minutes |
| Farmington: | 7 minutes |
| Ogden: | 6 minutes |
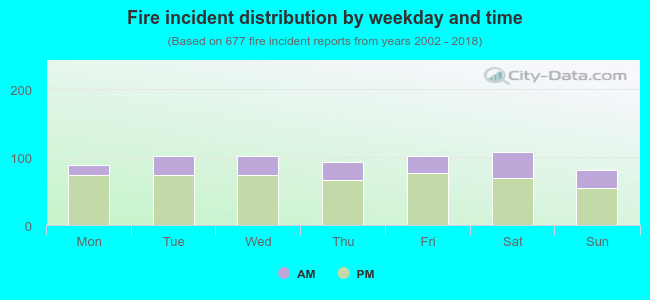 27.9% incidents where reported in the morning and 72.1% in the evening. The most fires (16.0%) took place on Saturday, and the least (12.0%) on Sunday.
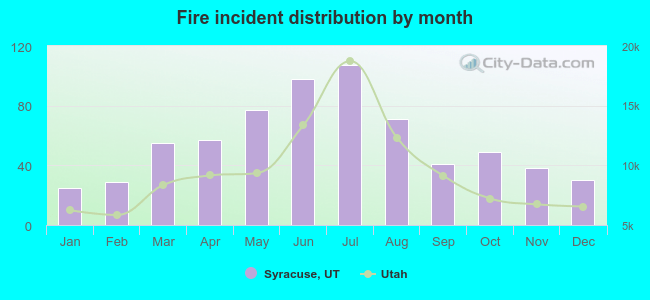 According to the 677 reports from years 2002 - 2018 most fires (15.8%) took place during July, and the least (3.7%) in January.
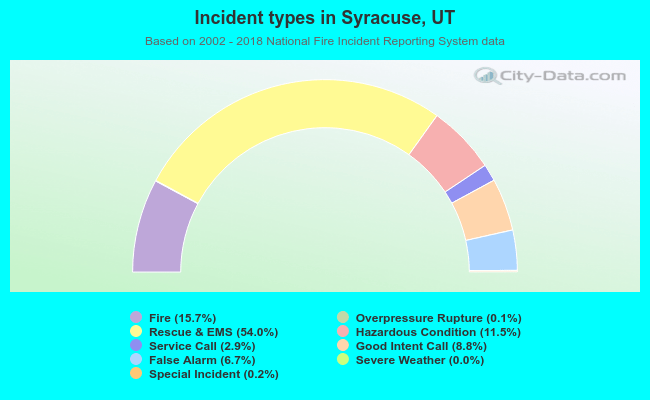 Out of all 4,312 cases reported during the years 2002 - 2018, the most belonged to the categories: Rescue & EMS (54.0%), Fire (15.7%), and Hazardous Condition (11.5%).
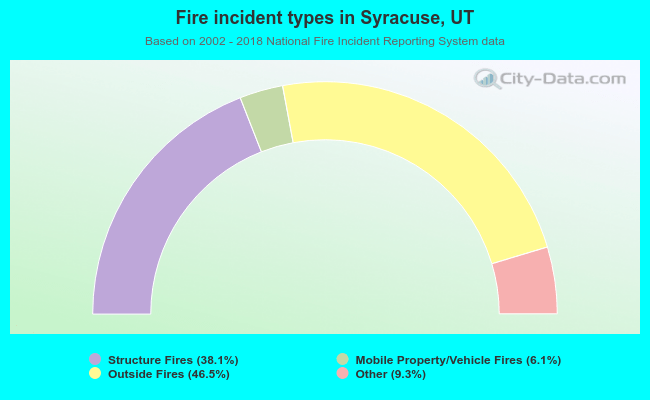 When looking into fire subcategories, the most reports belonged to: Outside Fires (46.5%), and Structure Fires (38.1%).