Roselle: Fire Incidents, Illinois (IL)
Where are fire incidents reported in Roselle, IL
Something went wrong! Please refresh the page.
| Fire incidents reported | |
|---|---|
| Sreet name | Count |
| IRVING PARK RD | 80 |
| RODENBURG RD | 60 |
| LAKE ST | 56 |
| PLUM GROVE RD | 56 |
| CENTRAL AVE | 44 |
| ROSELLE RD | 44 |
| BRYN MAWR AVE | 40 |
| GARY AVE | 38 |
| NERGE RD | 36 |
| SPRINGHILL DR | 36 |
| GARDEN AVE | 28 |
| DEVON AVE | 26 |
| DORCHESTER CT | 26 |
| FOSTER AVE | 24 |
| MEDINAH RD | 24 |
| FOREST AVE | 22 |
| CIRCLE DR | 20 |
| BRYN MAWR | 18 |
| WILLOW | 18 |
| AVEBURY LN | 16 |
| BORDEN DR | 16 |
| MAPLE | 16 |
| MAPLE AVE | 16 |
| NEWCASTLE DR | 16 |
| PRESCOTT DR | 16 |
| TURNER AVE | 16 |
| WOODFIELD TRL | 16 |
| WOODWORTH PL | 16 |
| CROSS CREEK DR | 14 |
| ELGIN O'HARE EXPRESSWAY | 14 |
| Other | 481 |
2002 - 2018 National Fire Incident Reporting System (NFIRS) incidents
- Incident types reported to NFIRS in Roselle, IL
- 6,17652.4%Rescue & EMS
- 1,47912.5%Hazardous Condition
- 1,34911.4%Fire
- 9458.0%Service Call
- 9237.8%Good Intent Call
- 9077.7%False Alarm
- Fire incident types reported to NFIRS in Roselle, IL
- 85663.5%Structure Fires
- 30422.5%Outside Fires
- 1259.3%Mobile Property/Vehicle Fires
- 644.7%Other
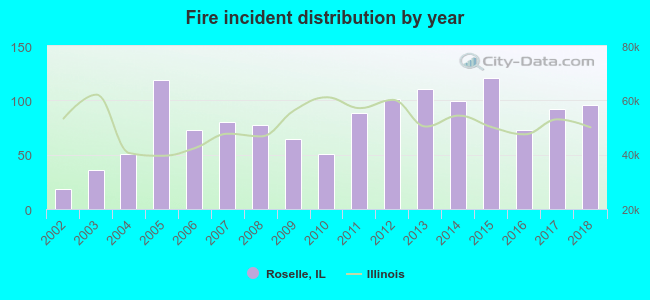 Based on the data from the years 2002 - 2018 the average number of fires per year is 79. The highest number of reported fire incidents - 121 took place in 2015, and the least - 18 in 2002. The data has an increasing trend.
The average number of yearly fire incidents per 10k residents in Roselle, IL compared to nearest cities:
(Note: Based on data for the last 3 years, including only cities with population 5,000 and above)
| Roselle: | 37.8 |
| Bloomingdale: | 34.5 |
| Hanover Park: | 24.4 |
| Schaumburg: | 18.3 |
| Itasca: | 53.8 |
| Glendale Heights: | 27.1 |
| Elk Grove Village: | 36.0 |
| Carol Stream: | 21.1 |
| Streamwood: | 21.8 |
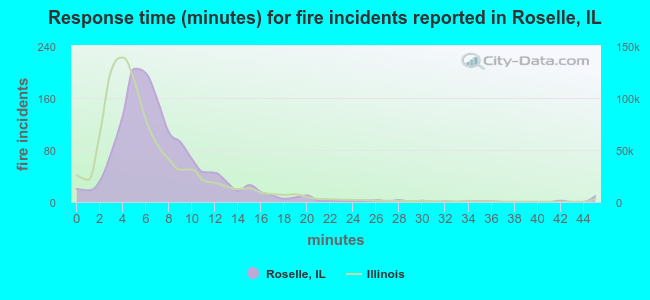 The median response time based on all reported fire incidents is 6 minutes. This is about the same as the Illinois median value.
The median response time in Roselle, IL compared to nearest cities:
(Note: Based on data for all years, including only cities with at least 500 fire incidents)
| Roselle: | 6 minutes |
| Bloomingdale: | 5 minutes |
| Hanover Park: | 4 minutes |
| Schaumburg: | 5 minutes |
| Itasca: | 6 minutes |
| Glendale Heights: | 5 minutes |
| Elk Grove Village: | 5 minutes |
| Carol Stream: | 5 minutes |
| Streamwood: | 5 minutes |
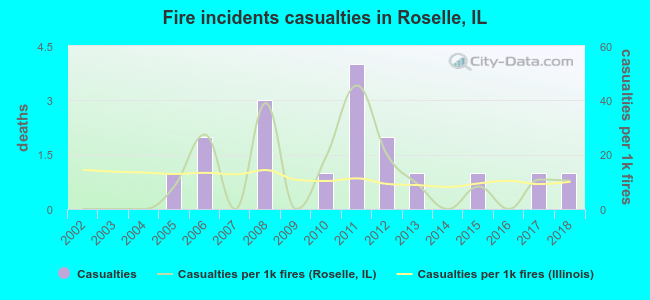 Based on the reports from the years 2002 - 2018 the average number of fire-related yearly casualties is 1. The highest number of reported casualties - 4 took place in 2011, and the lowest - 0 in 2002. The data has a growing trend.
The average number of casualties per 1,000 fire incidents is 12. This indicator was the highest - 45 in 2011, and the lowest 0 in 2002. The trend for injuries per 1,000 fires is increasing. Compared to the Illinois value the number of casualties per 1,000 fires is about the same.
Based on the reports from the years 2002 - 2018 the average number of fire-related yearly casualties is 1. The highest number of reported casualties - 4 took place in 2011, and the lowest - 0 in 2002. The data has a growing trend.
The average number of casualties per 1,000 fire incidents is 12. This indicator was the highest - 45 in 2011, and the lowest 0 in 2002. The trend for injuries per 1,000 fires is increasing. Compared to the Illinois value the number of casualties per 1,000 fires is about the same.Casualties per 1,000 incidents in Roselle, IL compared to nearest cities:
(Note: Based on data for all years, including only cities with at least 500 fire incidents)
| Roselle: | 12.6 |
| Bloomingdale: | 12.1 |
| Hanover Park: | 36.5 |
| Schaumburg: | 9.7 |
| Itasca: | 13.4 |
| Glendale Heights: | 20.1 |
| Elk Grove Village: | 14.2 |
| Carol Stream: | 7.4 |
| Streamwood: | 15.0 |
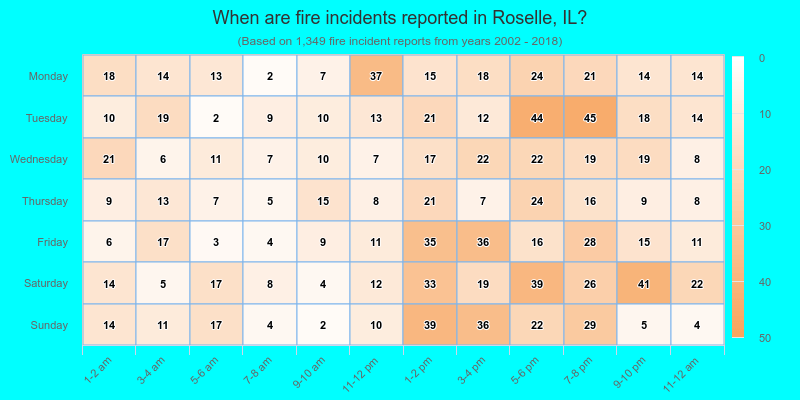
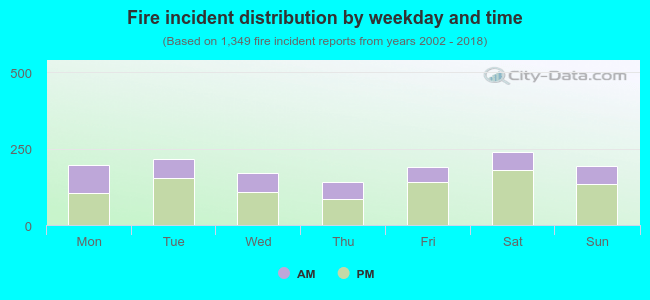 32.7% incidents where reported in the morning and 67.3% in the evening. The most fires (17.8%) took place on Saturday, and the least (10.5%) on Thursday.
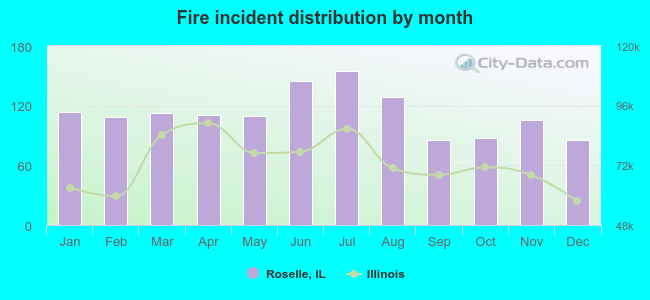 According to the 1,349 fire incidents from years 2002 - 2018 most fires (11.5%) took place during July, and the least (6.3%) in September.
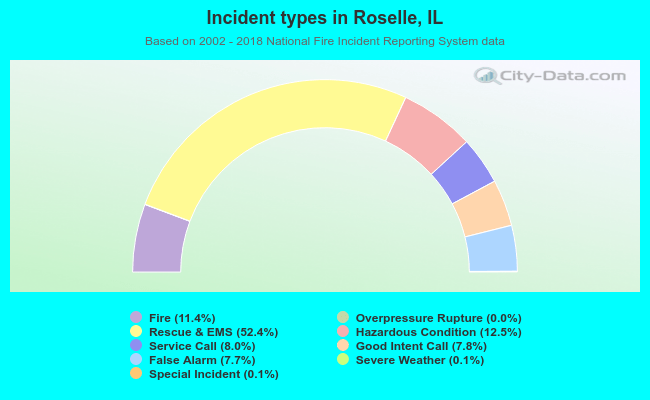 Out of all 11,795 cases reported during the years 2002 - 2018, the most belonged to the categories: Rescue & EMS (52.4%), Hazardous Condition (12.5%), and Fire (11.4%).
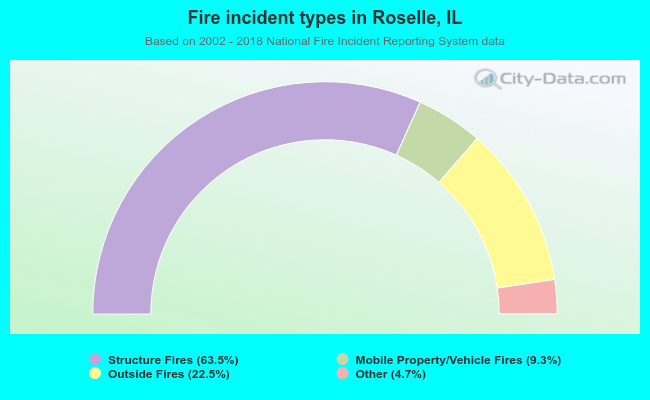 When looking into fire subcategories, the most incidents belonged to: Structure Fires (63.5%), and Outside Fires (22.5%).