Carol Stream: Fire Incidents, Illinois (IL)
Where are fire incidents reported in Carol Stream, IL
Something went wrong! Please refresh the page.
| Fire incidents reported | |
|---|---|
| Sreet name | Count |
| GUNDERSEN DR | 118 |
| LIES RD | 102 |
| ST CHARLES RD | 94 |
| SCHMALE RD | 92 |
| BLUFF ST | 80 |
| BURNS ST | 64 |
| ARMY TRAIL RD | 60 |
| NORTH AV | 60 |
| KLEIN CREEK CT | 52 |
| GARY AV | 44 |
| KUHN RD | 40 |
| ELK TR | 38 |
| COUNTY FARM RD | 34 |
| FULLERTON AV | 32 |
| ILLINI DR | 30 |
| QUAIL RUN CT | 30 |
| CENTER AVE | 28 |
| GENEVA RD | 28 |
| GUNDERSON | 26 |
| WOODLAKE DR | 26 |
| GUNDERSON DR | 24 |
| THORNHILL DR | 24 |
| NORTH AVE | 22 |
| WOODHILL DR | 22 |
| FULLERTON | 20 |
| FULLERTON AVE | 20 |
| MEADOW LN | 20 |
| SPRING VALLEY DR | 20 |
| WILLOW WOOD DR | 20 |
| COMMANCHE LN | 18 |
| Other | 328 |
2002 - 2018 National Fire Incident Reporting System (NFIRS) incidents
- Incident types reported to NFIRS in Carol Stream, IL
- 13,03664.8%Rescue & EMS
- 1,8989.4%Hazardous Condition
- 1,7998.9%False Alarm
- 1,6168.0%Fire
- 1,0005.0%Good Intent Call
- 7333.6%Service Call
- 280.1%Overpressure Rupture
- Fire incident types reported to NFIRS in Carol Stream, IL
- 99061.3%Structure Fires
- 40124.8%Outside Fires
- 1489.2%Mobile Property/Vehicle Fires
- 774.8%Other
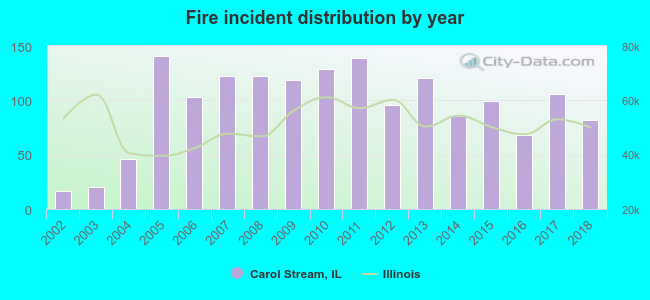 Based on the data from the years 2002 - 2018 the average number of fires per year is 95. The highest number of fire incidents - 141 took place in 2005, and the least - 17 in 2002. The data has a rising trend.
The average number of yearly fire incidents per 10k residents in Carol Stream, IL compared to nearest cities:
(Note: Based on data for the last 3 years, including only cities with population 5,000 and above)
| Carol Stream: | 21.1 |
| Glendale Heights: | 27.1 |
| Winfield: | 33.8 |
| Bloomingdale: | 34.5 |
| Hanover Park: | 24.4 |
| West Chicago: | 40.1 |
| Wheaton: | 18.3 |
| Bartlett: | 17.8 |
| Roselle: | 37.8 |
 The median response time based on all reported fire incidents is 5 minutes. This is comparable to the Illinois median value.
The median response time in Carol Stream, IL compared to nearest cities:
(Note: Based on data for all years, including only cities with at least 500 fire incidents)
| Carol Stream: | 5 minutes |
| Glendale Heights: | 5 minutes |
| Winfield: | 5 minutes |
| Bloomingdale: | 5 minutes |
| Hanover Park: | 4 minutes |
| West Chicago: | 6 minutes |
| Wheaton: | 5 minutes |
| Bartlett: | 5 minutes |
| Roselle: | 6 minutes |
 Based on the data from the years 2002 - 2018 the average number of fire-related casualties per year is 1. The highest number of reported casualties - 4 took place in 2008, and the lowest - 0 in 2002. The data has a growing trend.
The average number of injuries per 1,000 fires is 7. This indicator was the highest - 37 in 2018, and the lowest 0 in 2002. The trend for injuries per 1,000 fire incidents is increasing. Compared to the Illinois value the number of injuries per 1,000 fire incidents is lower.
Based on the data from the years 2002 - 2018 the average number of fire-related casualties per year is 1. The highest number of reported casualties - 4 took place in 2008, and the lowest - 0 in 2002. The data has a growing trend.
The average number of injuries per 1,000 fires is 7. This indicator was the highest - 37 in 2018, and the lowest 0 in 2002. The trend for injuries per 1,000 fire incidents is increasing. Compared to the Illinois value the number of injuries per 1,000 fire incidents is lower.Casualties per 1,000 incidents in Carol Stream, IL compared to nearest cities:
(Note: Based on data for all years, including only cities with at least 500 fire incidents)
| Carol Stream: | 7.4 |
| Glendale Heights: | 20.1 |
| Winfield: | 3.4 |
| Bloomingdale: | 12.1 |
| Hanover Park: | 36.5 |
| West Chicago: | 20.6 |
| Wheaton: | 12.6 |
| Bartlett: | 11.6 |
| Roselle: | 12.6 |
 30.3% incidents where reported in the morning and 69.7% in the evening. The most fires (16.2%) took place on Sunday, and the least (12.3%) on Thursday.
 Based on the 1,616 fire incidents from years 2002 - 2018 most fires (10.8%) took place during June, and the least (6.1%) in October.
 Out of all 20,125 cases reported during the years 2002 - 2018, the most belonged to the categories: Rescue & EMS (64.8%), Hazardous Condition (9.4%), and False Alarm (8.9%).
 When looking into fire subcategories, the most incidents belonged to: Structure Fires (61.3%), and Outside Fires (24.8%).