Sacramento: Fire Incidents, California (CA)
Where are fire incidents reported in Sacramento, CA
Something went wrong! Please refresh the page.
| Fire incidents reported | |
|---|---|
| Sreet name | Count |
| FLORIN RD | 772 |
| ARP | 714 |
| FRUITRIDGE RD | 708 |
| GARDEN HWY | 546 |
| MACK RD | 476 |
| 24TH ST | 458 |
| 16TH ST | 452 |
| EL CAMINO AV | 420 |
| STOCKTON BLVD | 416 |
| AUBURN BL | 402 |
| ANTELOPE RD | 400 |
| I ST | 378 |
| FOLSOM BL | 372 |
| 12TH ST | 358 |
| FRANKLIN BLVD | 356 |
| BRADSHAW RD | 342 |
| ELDER CREEK RD | 336 |
| 7TH ST | 334 |
| 10TH ST | 328 |
| 28TH ST | 320 |
| 47TH AVE | 316 |
| ARDEN WY | 304 |
| DEL PASO BLVD | 302 |
| STOCKTON BL | 286 |
| DEL PASO BL | 284 |
| BROADWAY | 278 |
| EL CAMINO AVE | 276 |
| J ST | 272 |
| GARDEN HY | 258 |
| LA RIVIERA DR | 258 |
| Other | 24,603 |
2005 - 2018 National Fire Incident Reporting System (NFIRS) incidents
- Incident types reported to NFIRS in Sacramento, CA
- 271,35163.2%Rescue & EMS
- 65,94715.3%Good Intent Call
- 36,3258.5%Fire
- 26,7566.2%Service Call
- 15,4973.6%False Alarm
- 11,0772.6%Hazardous Condition
- 1,4670.3%Overpressure Rupture
- 1,2300.3%Special Incident
- Fire incident types reported to NFIRS in Sacramento, CA
- 21,21558.4%Outside Fires
- 7,42620.4%Structure Fires
- 6,02816.6%Mobile Property/Vehicle Fires
- 1,6564.6%Other
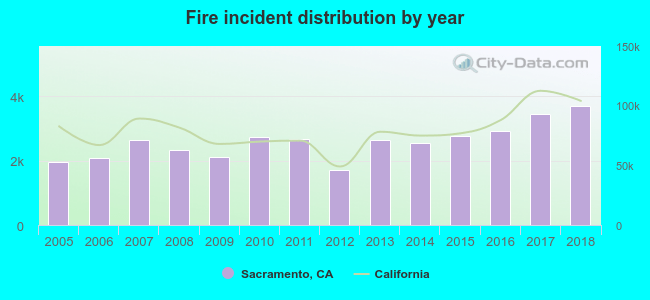 According to the data from the years 2005 - 2018 the average number of fires per year is 2,595. The highest number of fires - 3,714 took place in 2018, and the least - 1,712 in 2012. The data has a rising trend.
The average number of yearly fire incidents per 10k residents in Sacramento, CA compared to nearest cities:
(Note: Based on data for the last 3 years, including only cities with population 5,000 and above)
| Sacramento: | 69.5 |
| West Sacramento: | 58.9 |
| Florin: | 51.8 |
| Mather: | 36.7 |
| Rio Linda: | 39.7 |
| Laguna: | 0.5 |
| Elk Grove: | 2.5 |
| Rancho Cordova: | 32.6 |
| North Highlands: | 46.8 |
 The median response time based on all reported fire incidents is 5 minutes. This is lower compared to the California median value.
The median response time in Sacramento, CA compared to nearest cities:
(Note: Based on data for all years, including only cities with at least 500 fire incidents)
| Sacramento: | 5 minutes |
| West Sacramento: | 5 minutes |
| Florin: | 5 minutes |
| Mather: | 6 minutes |
| Rio Linda: | 5 minutes |
| Elk Grove: | 6 minutes |
| Rancho Cordova: | 5 minutes |
| North Highlands: | 5 minutes |
| Carmichael: | 5 minutes |
 Based on the reports from the years 2005 - 2018 the average number of fire-related yearly deaths is 2. The highest number of deaths - 4 took place in 2006, and the lowest - 0 in 2011. The data has a rising trend.
The average number of deaths per 1,000 fires is 1. This indicator was the highest - 2 in 2006, and the lowest 0 in 2011. The trend for fatalities per 1,000 incidents is declining. Compared to the California value the number of fatalities per 1,000 fire incidents is much lower.
Based on the reports from the years 2005 - 2018 the average number of fire-related yearly deaths is 2. The highest number of deaths - 4 took place in 2006, and the lowest - 0 in 2011. The data has a rising trend.
The average number of deaths per 1,000 fires is 1. This indicator was the highest - 2 in 2006, and the lowest 0 in 2011. The trend for fatalities per 1,000 incidents is declining. Compared to the California value the number of fatalities per 1,000 fire incidents is much lower.Deaths per 1,000 incidents in Sacramento, CA compared to nearest cities:
(Note: Based on data for all years, including only cities with at least 2,500 fire incidents)
| Sacramento: | 0.6 |
| Florin: | 0.0 |
| Mather: | 0.0 |
| Rancho Cordova: | 0.8 |
| Roseville: | 0.4 |
| Woodland: | 1.0 |
 Based on the data from the years 2005 - 2018 the average number of fire-related yearly casualties is 6. The highest number of reported casualties - 15 took place in 2008, and the lowest - 1 in 2015. The data has a constant trend.
The average number of casualties per 1,000 fires is 2. This indicator was the highest - 6 in 2008, and the lowest 0 in 2017. The trend for injuries per 1,000 fires is decreasing. Compared to the state value the number of casualties per 1,000 incidents is much lower.
Based on the data from the years 2005 - 2018 the average number of fire-related yearly casualties is 6. The highest number of reported casualties - 15 took place in 2008, and the lowest - 1 in 2015. The data has a constant trend.
The average number of casualties per 1,000 fires is 2. This indicator was the highest - 6 in 2008, and the lowest 0 in 2017. The trend for injuries per 1,000 fires is decreasing. Compared to the state value the number of casualties per 1,000 incidents is much lower.Casualties per 1,000 incidents in Sacramento, CA compared to nearest cities:
(Note: Based on data for all years, including only cities with at least 500 fire incidents)
| Sacramento: | 2.3 |
| West Sacramento: | 4.0 |
| Florin: | 3.6 |
| Mather: | 0.0 |
| Rio Linda: | 1.2 |
| Elk Grove: | 1.0 |
| Rancho Cordova: | 4.0 |
| North Highlands: | 0.0 |
| Carmichael: | 5.6 |
 36.4% incidents where reported in the morning and 63.6% in the evening. The most fires (15.1%) took place on Sunday, and the least (13.6%) on Thursday.
 According to the 36,325 fire incidents from years 2005 - 2018 most fires (13.9%) took place during July, and the least (5.5%) in February.
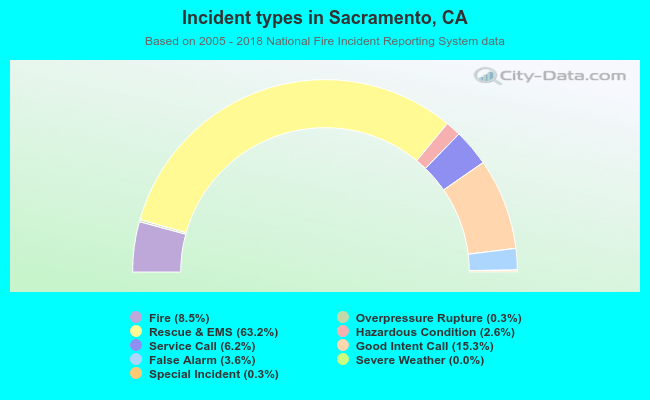 Out of all 429,678 cases reported during the years 2005 - 2018, the most belonged to the categories: Rescue & EMS (63.2%), Good Intent Call (15.3%), and Fire (8.5%).
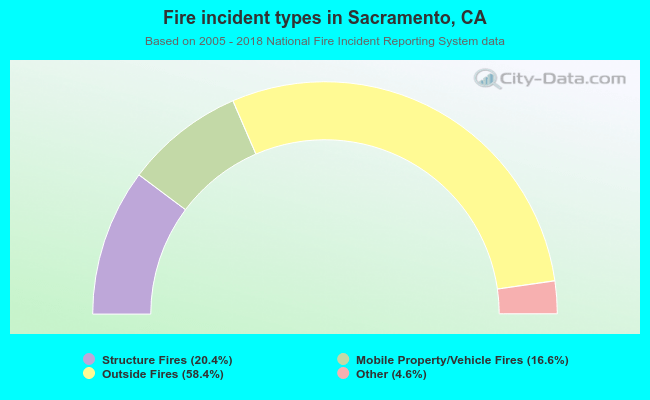 When looking into fire subcategories, the most incidents belonged to: Outside Fires (58.4%), and Structure Fires (20.4%).