Savanna: Fire Incidents, Illinois (IL)
Where are fire incidents reported in Savanna, IL
Something went wrong! Please refresh the page.
|
| |||||||||||||||||||||||||||||||||||||||||||||||||||||||||||||||||||||||||||||||||||||||||||||||||||||||||||||
2002 - 2018 National Fire Incident Reporting System (NFIRS) incidents
- Incident types reported to NFIRS in Savanna, IL
- 51540.6%Fire
- 33526.4%Hazardous Condition
- 23218.3%Rescue & EMS
- 816.4%False Alarm
- 544.3%Good Intent Call
- 443.5%Service Call
- 50.4%Severe Weather
- 30.2%Overpressure Rupture
- Fire incident types reported to NFIRS in Savanna, IL
- 24247.0%Structure Fires
- 19838.4%Outside Fires
- 6111.8%Mobile Property/Vehicle Fires
- 142.7%Other
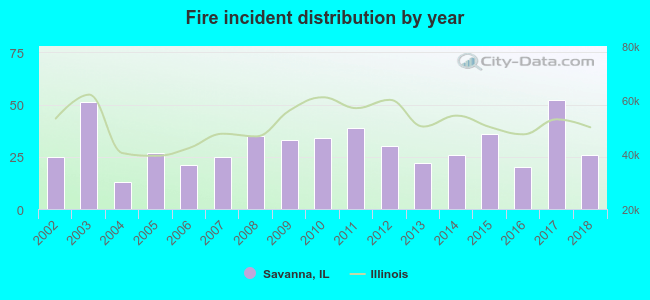 According to the data from the years 2002 - 2018 the average number of fires per year is 30. The highest number of reported fire incidents - 52 took place in 2017, and the least - 13 in 2004. The data has a growing trend.
 The median response time based on all reported fire incidents is 8 minutes. This is higher compared to the Illinois median value.
The median response time in Savanna, IL compared to nearest cities:
(Note: Based on data for all years, including only cities with at least 500 fire incidents)
| Savanna: | 8 minutes |
| Morrison: | 7 minutes |
| Freeport: | 5 minutes |
| Polo: | 12 minutes |
| Sterling: | 8 minutes |
| Rock Falls: | 7 minutes |
 31.3% incidents where reported in the morning and 68.7% in the evening. The most fires (19.6%) took place on Sunday, and the least (10.3%) on Tuesday.
 According to the 515 fire incidents from years 2002 - 2018 most fires (15.3%) took place during March, and the least (4.1%) in December.
 Out of all 1,270 cases reported during the years 2002 - 2018, the most belonged to the categories: Fire (40.6%), Hazardous Condition (26.4%), and Rescue & EMS (18.3%).
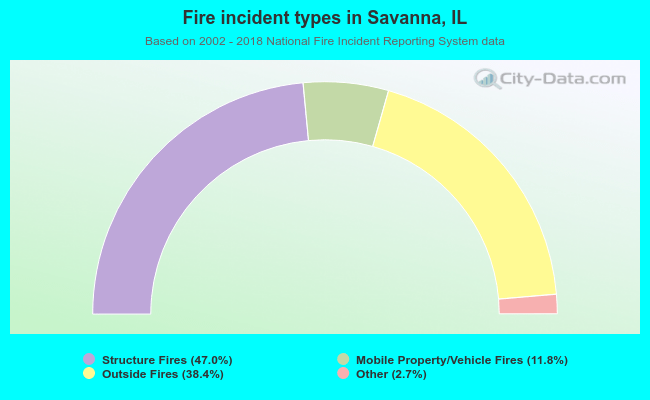 When looking into fire subcategories, the most incidents belonged to: Structure Fires (47.0%), and Outside Fires (38.4%).