Sterling: Fire Incidents, Illinois (IL)
Where are fire incidents reported in Sterling, IL
Something went wrong! Please refresh the page.
| Fire incidents reported | |
|---|---|
| Sreet name | Count |
| GALT RD | 102 |
| LINCOLNWAY | 88 |
| 3RD ST | 86 |
| 4TH ST | 86 |
| 4TH | 82 |
| 5TH ST | 80 |
| 1ST AVE | 74 |
| FREEPORT RD | 72 |
| LEFEVRE RD | 68 |
| 6TH AVE | 58 |
| FULFS RD | 52 |
| 3RD | 50 |
| 4TH AVE | 48 |
| MOLINE RD | 44 |
| PENROSE RD | 42 |
| LOCUST ST | 38 |
| 1 AVE | 36 |
| 5TH AVE | 36 |
| LOCUST | 36 |
| WALLACE ST | 36 |
| POLO RD | 34 |
| 6 AVE | 30 |
| 8TH AVE | 30 |
| DILLON AVE | 30 |
| MATHEW RD | 30 |
| 19TH | 28 |
| 23RD ST | 28 |
| AVENUE K | 28 |
| EMERSON RD | 28 |
| 7TH AVE | 26 |
| Other | 370 |
2002 - 2018 National Fire Incident Reporting System (NFIRS) incidents
- Incident types reported to NFIRS in Sterling, IL
- 3,12629.7%Rescue & EMS
- 1,87617.8%Fire
- 1,83717.5%Hazardous Condition
- 1,27412.1%False Alarm
- 1,21611.6%Service Call
- 1,17511.2%Good Intent Call
- Fire incident types reported to NFIRS in Sterling, IL
- 1,03255.0%Structure Fires
- 53428.5%Outside Fires
- 22512.0%Mobile Property/Vehicle Fires
- 854.5%Other
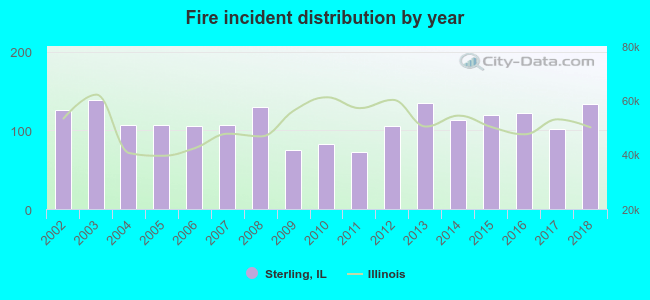 Based on the data from the years 2002 - 2018 the average number of fire incidents per year is 110. The highest number of fires - 138 took place in 2003, and the least - 72 in 2011. The data has an increasing trend.
The average number of yearly fire incidents per 10k residents in Sterling, IL compared to nearest cities:
(Note: Based on data for the last 3 years, including only cities with population 5,000 and above)
| Sterling: | 79.1 |
| Rock Falls: | 78.7 |
| Dixon: | 92.5 |
| Princeton: | 61.1 |
| Rochelle: | 65.7 |
| Geneseo: | 44.9 |
| Mendota: | 56.5 |
| Freeport: | 49.9 |
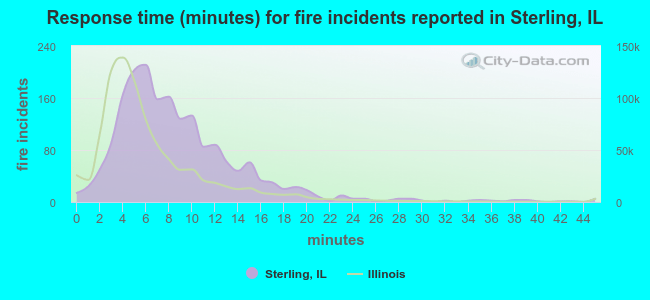 The median response time based on all reported fire incidents is 8 minutes. This is higher compared to the Illinois median value.
The median response time in Sterling, IL compared to nearest cities:
(Note: Based on data for all years, including only cities with at least 500 fire incidents)
| Sterling: | 8 minutes |
| Rock Falls: | 7 minutes |
| Dixon: | 7 minutes |
| Morrison: | 7 minutes |
| Polo: | 12 minutes |
| Amboy: | 11 minutes |
| Oregon: | 8 minutes |
| Savanna: | 8 minutes |
| Princeton: | 8 minutes |
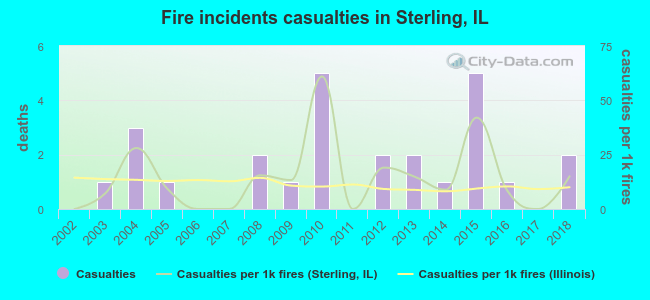 Based on the reports from the years 2002 - 2018 the average number of fire-related yearly casualties is 2. The highest number of reported casualties - 5 took place in 2010, and the lowest - 0 in 2002. The data has a rising trend.
The average number of injuries per 1,000 fire incidents is 14. This indicator was the highest - 61 in 2010, and the lowest 0 in 2002. The trend for injuries per 1,000 fires is rising. Compared to the state value the number of injuries per 1,000 fires is higher.
Based on the reports from the years 2002 - 2018 the average number of fire-related yearly casualties is 2. The highest number of reported casualties - 5 took place in 2010, and the lowest - 0 in 2002. The data has a rising trend.
The average number of injuries per 1,000 fire incidents is 14. This indicator was the highest - 61 in 2010, and the lowest 0 in 2002. The trend for injuries per 1,000 fires is rising. Compared to the state value the number of injuries per 1,000 fires is higher.
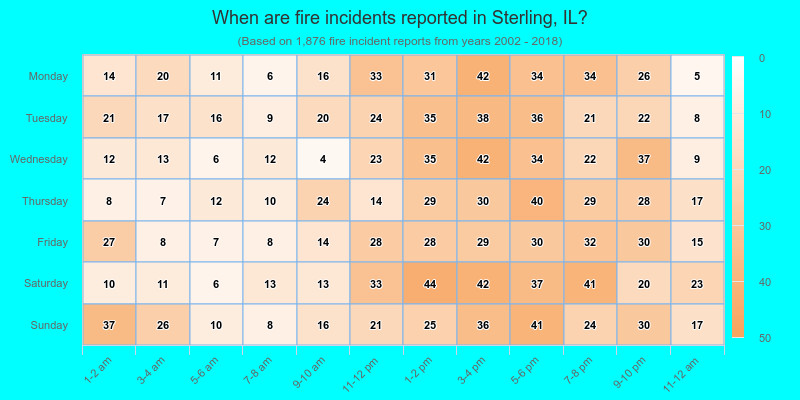
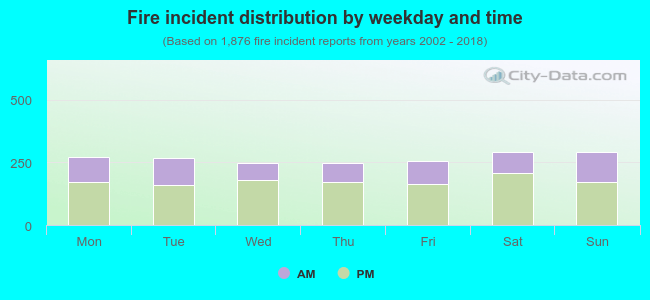 34.5% incidents where reported in the morning and 65.5% in the evening. The most fires (15.6%) took place on Saturday, and the least (13.2%) on Thursday.
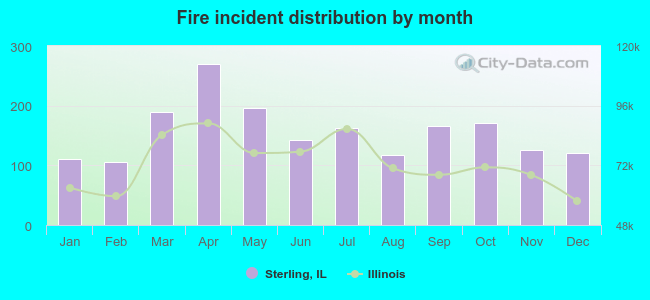 According to the 1,876 fire incident reports from years 2002 - 2018 most fires (14.4%) took place during April, and the least (5.6%) in February.
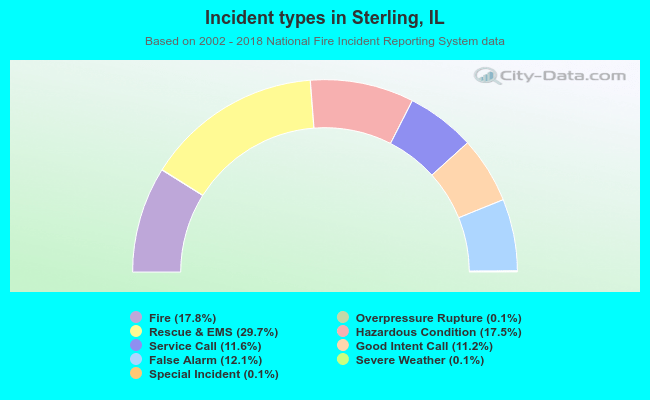 Out of all 10,527 cases reported during the years 2002 - 2018, the most belonged to the categories: Rescue & EMS (29.7%), Fire (17.8%), and Hazardous Condition (17.5%).
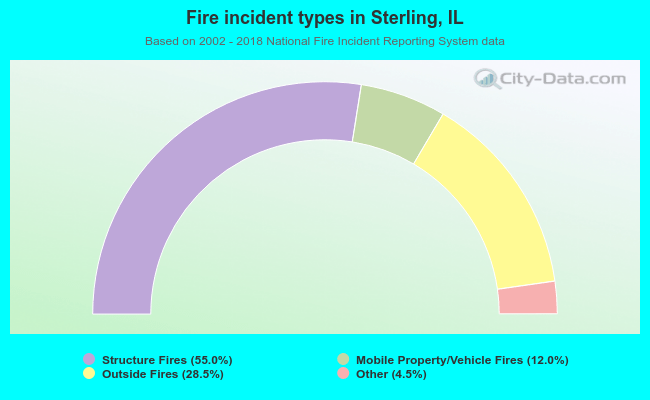 When looking into fire subcategories, the most incidents belonged to: Structure Fires (55.0%), and Outside Fires (28.5%).