Seymour: Fire Incidents, Connecticut (CT)
Where are fire incidents reported in Seymour, CT
Something went wrong! Please refresh the page.
| Fire incidents reported | |
|---|---|
| Sreet name | Count |
| RTE 8 X 22 | 46 |
| DERBY AVE | 24 |
| MAIN ST | 24 |
| DERBY AVE. | 22 |
| RTE 8 X 21 | 22 |
| SILVERMINE RD. | 22 |
| BANK ST | 20 |
| BUNGAY RD. | 20 |
| ROOSEVELT DR | 18 |
| SO. MAIN ST. | 18 |
| BALANCE ROCK RD | 16 |
| BOTSFORD RD | 16 |
| DERBY AVE | 16 |
| NORTH ST. | 16 |
| BANK ST | 14 |
| BANK ST. | 14 |
| BUNGAY RD | 14 |
| BUNGAY RD | 14 |
| DEFOREST ST | 14 |
| MAPLE ST | 14 |
| NEW HAVEN RD. | 14 |
| ROOSEVELT DR | 14 |
| BALANCE ROCK RD | 12 |
| CEDAR ST | 12 |
| MAPLE ST | 12 |
| MOSS AVE. | 12 |
| MOUNTAIN RD | 12 |
| STATE 8 HWY | 12 |
| DAVIS RD. | 10 |
| PEARL ST | 10 |
| Other | 241 |
2002 - 2018 National Fire Incident Reporting System (NFIRS) incidents
- Incident types reported to NFIRS in Seymour, CT
- 2,35446.9%Hazardous Condition
- 74514.9%Fire
- 64112.8%False Alarm
- 58411.6%Service Call
- 3416.8%Good Intent Call
- 3246.5%Rescue & EMS
- 130.3%Overpressure Rupture
- 70.1%Special Incident
- Fire incident types reported to NFIRS in Seymour, CT
- 28538.3%Outside Fires
- 24633.0%Structure Fires
- 18424.7%Mobile Property/Vehicle Fires
- 304.0%Other
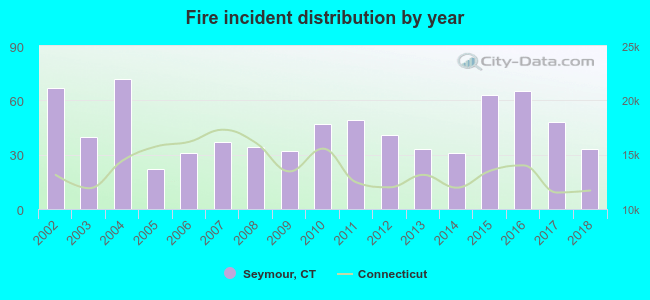 Based on the data from the years 2002 - 2018 the average number of fire incidents per year is 44. The highest number of fires - 72 took place in 2004, and the least - 22 in 2005. The data has a declining trend.
The average number of yearly fire incidents per 10k residents in Seymour, CT compared to nearest cities:
(Note: Based on data for the last 3 years, including only cities with population 5,000 and above)
| Seymour: | 29.4 |
| Ansonia: | 49.2 |
| Beacon Falls: | 40.8 |
| Oxford: | 26.3 |
| Woodbridge: | 51.2 |
| Derby: | 47.0 |
| Bethany: | 11.4 |
| Riverside: | 18.6 |
| Shelton: | 16.1 |
 The median response time based on all reported fire incidents is 5 minutes. This is close to the state median value.
The median response time in Seymour, CT compared to nearest cities:
(Note: Based on data for all years, including only cities with at least 500 fire incidents)
| Seymour: | 5 minutes |
| Ansonia: | 4 minutes |
| Oxford: | 6 minutes |
| Derby: | 3 minutes |
| Shelton: | 7 minutes |
| Naugatuck: | 4 minutes |
| Orange: | 5 minutes |
| Monroe: | 6 minutes |
| Hamden: | 4 minutes |
 According to the data from the years 2002 - 2018 the average number of fire-related fatalities per year is 0. The highest number of deaths - 1 took place in 2013, and the lowest - 0 in 2002. The data has a rising trend.
 According to the reports from the years 2002 - 2018 the average number of fire-related casualties per year is 0. The highest number of injuries - 2 took place in 2002, and the lowest - 0 in 2003. The data has a decreasing trend.
The average number of casualties per 1,000 fires is 10. This indicator was the highest - 54 in 2007, and the lowest 0 in 2003. The trend for casualties per 1,000 incidents is declining. Compared to the state value the number of casualties per 1,000 fire incidents is about the same.
According to the reports from the years 2002 - 2018 the average number of fire-related casualties per year is 0. The highest number of injuries - 2 took place in 2002, and the lowest - 0 in 2003. The data has a decreasing trend.
The average number of casualties per 1,000 fires is 10. This indicator was the highest - 54 in 2007, and the lowest 0 in 2003. The trend for casualties per 1,000 incidents is declining. Compared to the state value the number of casualties per 1,000 fire incidents is about the same.
 27.0% incidents where reported in the morning and 73.0% in the evening. The most fires (16.1%) took place on Friday, and the least (12.2%) on Tuesday.
 According to the 745 fires from years 2002 - 2018 most fires (13.6%) took place during April, and the least (6.0%) in August.
 Out of all 5,014 cases reported during the years 2002 - 2018, the most belonged to the categories: Hazardous Condition (46.9%), Fire (14.9%), and False Alarm (12.8%).
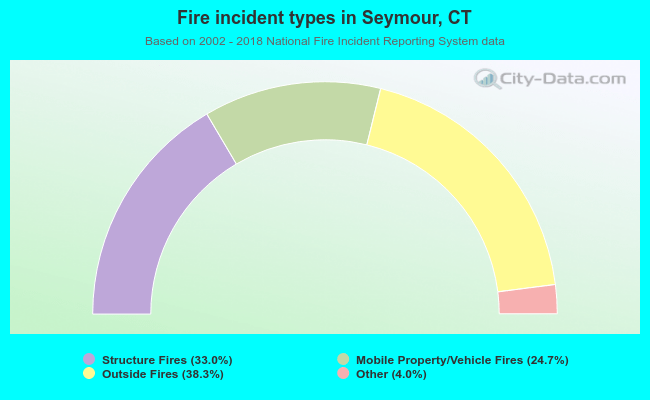 When looking into fire subcategories, the most incidents belonged to: Outside Fires (38.3%), and Structure Fires (33.0%).