Shippensburg: Fire Incidents, Pennsylvania (PA)
Where are fire incidents reported in Shippensburg, PA
Something went wrong! Please refresh the page.
| Fire incidents reported | |
|---|---|
| Sreet name | Count |
| KING ST | 156 |
| EARL ST | 88 |
| RITNER HWY | 80 |
| WALNUT BOTTOM RD | 72 |
| INTERSTATE 81 | 70 |
| 81 INT | 58 |
| RIDGE RD | 54 |
| OLDE SCOTLAND RD | 50 |
| RICHARD AVE | 50 |
| BURD ST | 48 |
| ORANGE ST | 48 |
| PENN ST | 44 |
| INTERSTATE ??81 | 42 |
| MAINSVILLE RD | 40 |
| QUEEN ST | 40 |
| BALTIMORE RD | 38 |
| GOODHART RD | 38 |
| ORRSTOWN RD | 38 |
| STROHM RD | 38 |
| BRITTON RD | 34 |
| GARFIELD ST | 34 |
| HIGH ST | 32 |
| ORRSTOWN (200-3000) RD | 32 |
| FAYETTE ST | 30 |
| KLINE RD | 30 |
| OAKVILLE RD | 30 |
| ROXBURY RD | 28 |
| HERSHEY RD | 26 |
| MOLLY PITCHER (6768-10099 HWY | 26 |
| MOLLY PITCHER HWY | 26 |
| Other | 490 |
2004 - 2018 National Fire Incident Reporting System (NFIRS) incidents
- Incident types reported to NFIRS in Shippensburg, PA
- 1,91042.2%Fire
- 71415.8%Hazardous Condition
- 60613.4%Rescue & EMS
- 57112.6%Good Intent Call
- 3587.9%False Alarm
- 3197.0%Service Call
- 260.6%Severe Weather
- 240.5%Special Incident
- Fire incident types reported to NFIRS in Shippensburg, PA
- 1,05255.1%Structure Fires
- 44923.5%Outside Fires
- 22711.9%Mobile Property/Vehicle Fires
- 1829.5%Other
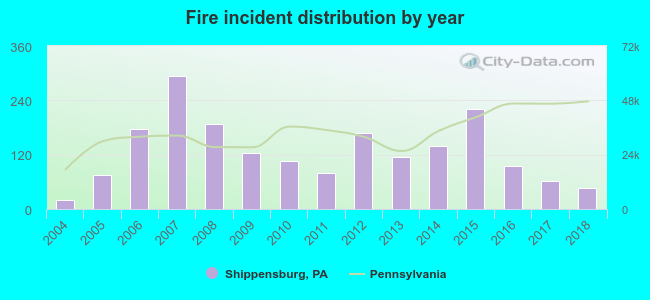 Based on the data from the years 2004 - 2018 the average number of fire incidents per year is 127. The highest number of reported fires - 294 took place in 2007, and the least - 20 in 2004. The data has a growing trend.
The average number of yearly fire incidents per 10k residents in Shippensburg, PA compared to nearest cities:
(Note: Based on data for the last 3 years, including only cities with population 5,000 and above)
| Shippensburg: | 122.1 |
| Chambersburg: | 74.6 |
| Carlisle: | 88.1 |
| Waynesboro: | 61.6 |
| Gettysburg: | 106.1 |
 The median response time based on all reported fire incidents is 7 minutes. This is about the same as the state median value.
The median response time in Shippensburg, PA compared to nearest cities:
(Note: Based on data for all years, including only cities with at least 500 fire incidents)
| Shippensburg: | 7 minutes |
| Fayetteville: | 7 minutes |
| Newville: | 11 minutes |
| Chambersburg: | 6 minutes |
| Carlisle: | 7 minutes |
| Waynesboro: | 8 minutes |
| Gettysburg: | 11 minutes |
| Mercersburg: | 11 minutes |
| Emmitsburg: | 10 minutes |
 34.5% incidents where reported in the morning and 65.5% in the evening. The most fires (15.4%) took place on Friday, and the least (12.6%) on Tuesday.
 Based on the 1,910 fire incidents from years 2004 - 2018 most fires (11.7%) took place during March, and the least (5.9%) in October.
 Out of all 4,530 cases reported during the years 2004 - 2018, the most belonged to the categories: Fire (42.2%), Hazardous Condition (15.8%), and Rescue & EMS (13.4%).
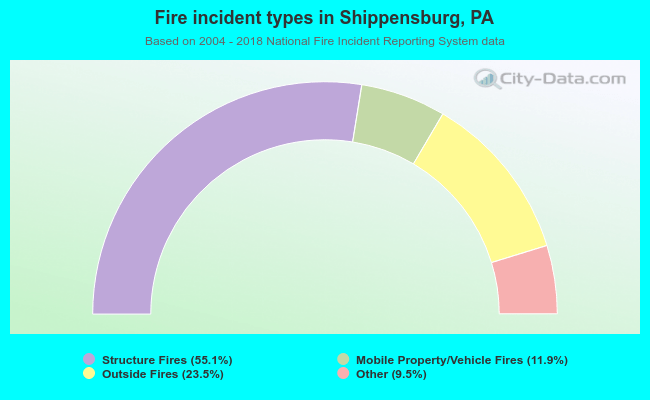 When looking into fire subcategories, the most reports belonged to: Structure Fires (55.1%), and Outside Fires (23.5%).