Carlisle: Fire Incidents, Pennsylvania (PA)
Where are fire incidents reported in Carlisle, PA
Something went wrong! Please refresh the page.
| Fire incidents reported | |
|---|---|
| Sreet name | Count |
| HANOVER ST | 338 |
| HARRISBURG PIKE | 208 |
| HIGH ST | 192 |
| NORTH ST | 148 |
| PITT ST | 146 |
| SPRING RD | 140 |
| LOUTHER ST | 138 |
| 81 INT | 122 |
| WALNUT BOTTOM RD | 114 |
| RITNER HWY | 92 |
| WEST ST | 90 |
| EAST ST | 86 |
| POMFRET ST | 86 |
| INTERSTATE 81 | 82 |
| COLLEGE ST | 78 |
| BEDFORD ST | 74 |
| PENN ST | 72 |
| TRINDLE RD | 70 |
| NOBLE BLVD | 64 |
| PA TURNPIKE | 58 |
| NEWVILLE RD | 56 |
| WAGGONERS GAP RD | 56 |
| ENOLA RD | 54 |
| MIDDLESEX RD | 54 |
| SPRING GARDEN ST | 54 |
| OLD YORK RD | 46 |
| PENNSYLVANIA TPKE | 46 |
| SOUTH ST | 46 |
| YORK RD | 46 |
| B ST | 44 |
| Other | 654 |
2003 - 2018 National Fire Incident Reporting System (NFIRS) incidents
- Incident types reported to NFIRS in Carlisle, PA
- 3,55430.0%Fire
- 2,87124.2%Hazardous Condition
- 1,76614.9%Rescue & EMS
- 1,76614.9%Good Intent Call
- 1,23710.4%False Alarm
- 5604.7%Service Call
- 600.5%Severe Weather
- 290.2%Special Incident
- 210.2%Overpressure Rupture
- Fire incident types reported to NFIRS in Carlisle, PA
- 1,98255.8%Structure Fires
- 69719.6%Outside Fires
- 65318.4%Mobile Property/Vehicle Fires
- 2226.2%Other
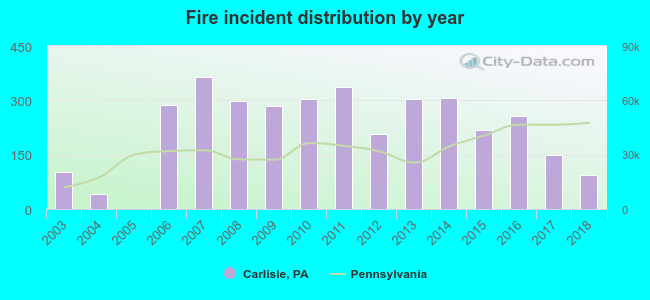 Based on the data from the years 2003 - 2018 the average number of fire incidents per year is 222. The highest number of reported fire incidents - 364 took place in 2007, and the least - 1 in 2005. The data has a decreasing trend.
The average number of yearly fire incidents per 10k residents in Carlisle, PA compared to nearest cities:
(Note: Based on data for the last 3 years, including only cities with population 5,000 and above)
| Carlisle: | 88.1 |
| Mechanicsburg: | 254.2 |
| Camp Hill: | 137.3 |
| Enola: | 148.4 |
| New Cumberland: | 60.1 |
| Harrisburg: | 188.7 |
| Steelton: | 64.1 |
| Shippensburg: | 122.1 |
| Middletown: | 69.5 |
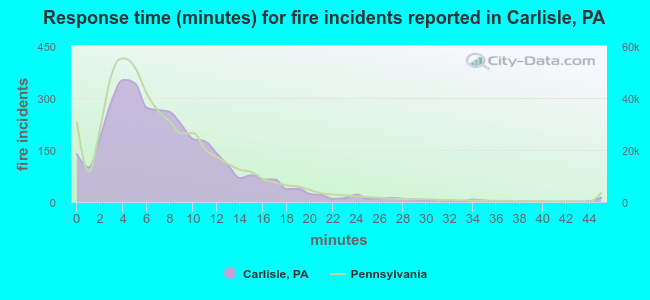 The median response time based on all reported fire incidents is 7 minutes. This is close to the Pennsylvania median value.
The median response time in Carlisle, PA compared to nearest cities:
(Note: Based on data for all years, including only cities with at least 500 fire incidents)
| Carlisle: | 7 minutes |
| Mechanicsburg: | 9 minutes |
| Dillsburg: | 10 minutes |
| Newville: | 11 minutes |
| Camp Hill: | 8 minutes |
| Enola: | 8 minutes |
| Duncannon: | 11 minutes |
| New Cumberland: | 9 minutes |
| Harrisburg: | 6 minutes |
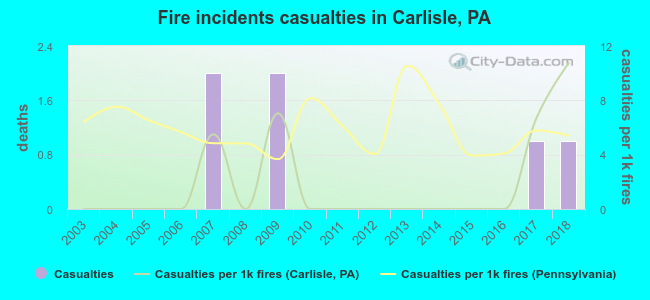 Based on the reports from the years 2003 - 2018 the average number of fire-related casualties per year is 0. The highest number of reported injuries - 2 took place in 2007, and the lowest - 0 in 2003. The data has a growing trend.
The average number of casualties per 1,000 fires is 2. This indicator was the highest - 11 in 2018, and the lowest 0 in 2003. The trend for injuries per 1,000 fire incidents is rising. Compared to the state value the number of casualties per 1,000 fire incidents is much lower.
Based on the reports from the years 2003 - 2018 the average number of fire-related casualties per year is 0. The highest number of reported injuries - 2 took place in 2007, and the lowest - 0 in 2003. The data has a growing trend.
The average number of casualties per 1,000 fires is 2. This indicator was the highest - 11 in 2018, and the lowest 0 in 2003. The trend for injuries per 1,000 fire incidents is rising. Compared to the state value the number of casualties per 1,000 fire incidents is much lower.Casualties per 1,000 incidents in Carlisle, PA compared to nearest cities:
(Note: Based on data for all years, including only cities with at least 500 fire incidents)
| Carlisle: | 1.7 |
| Mechanicsburg: | 1.4 |
| Dillsburg: | 0.0 |
| Newville: | 0.0 |
| Camp Hill: | 2.0 |
| Enola: | 0.8 |
| Duncannon: | 0.0 |
| New Cumberland: | 1.3 |
| Harrisburg: | 6.2 |
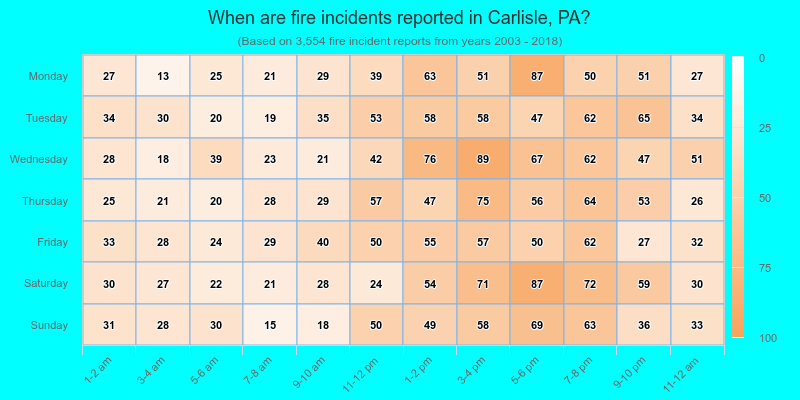
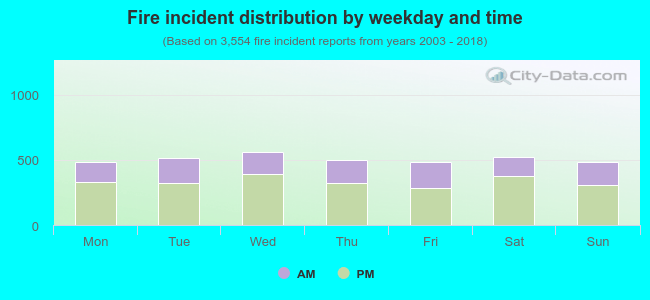 34.4% incidents where reported in the morning and 65.6% in the evening. The most fires (15.8%) took place on Wednesday, and the least (13.5%) on Sunday.
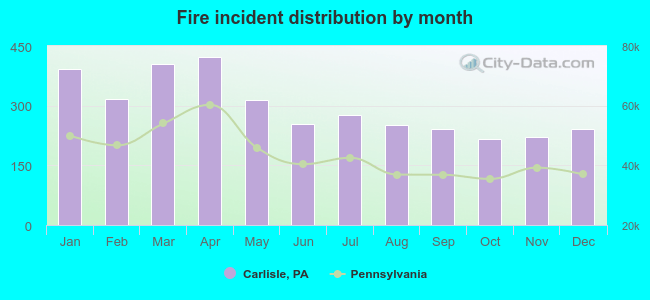 Based on the 3,554 fires from years 2003 - 2018 most fires (11.9%) took place during April, and the least (6.1%) in October.
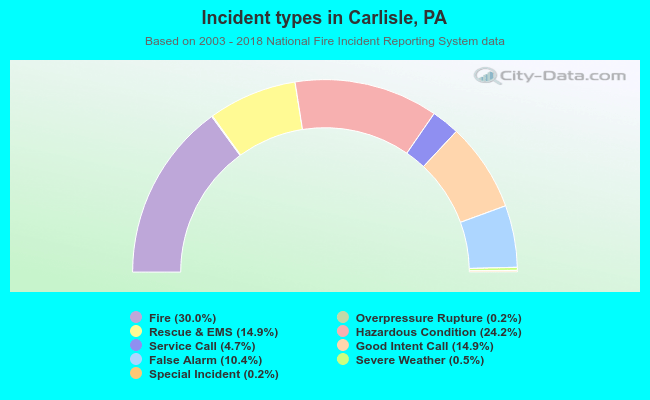 Out of all 11,864 cases reported during the years 2003 - 2018, the most belonged to the categories: Fire (30.0%), Hazardous Condition (24.2%), and Rescue & EMS (14.9%).
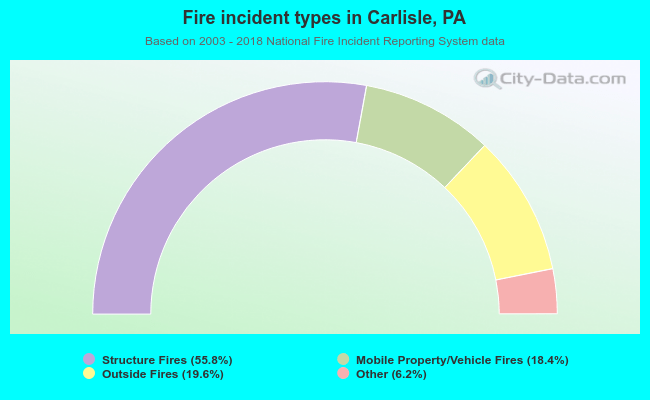 When looking into fire subcategories, the most incidents belonged to: Structure Fires (55.8%), and Outside Fires (19.6%).