Shrewsbury: Fire Incidents, Missouri (MO)
Where are fire incidents reported in Shrewsbury, MO
Something went wrong! Please refresh the page.
|
| |||||||||||||||||||||||||||||||||||||||||||||||||||||||||||||||||||||||||||||||||||||||||||||||||||||||||||||
2002 - 2018 National Fire Incident Reporting System (NFIRS) incidents
- Incident types reported to NFIRS in Shrewsbury, MO
- 2,84156.7%Rescue & EMS
- 54110.8%Hazardous Condition
- 52410.5%Fire
- 50810.1%Good Intent Call
- 4028.0%False Alarm
- 1693.4%Service Call
- 130.3%Severe Weather
- 80.2%Overpressure Rupture
- 80.2%Special Incident
- Fire incident types reported to NFIRS in Shrewsbury, MO
- 28153.6%Structure Fires
- 10720.4%Outside Fires
- 8015.3%Other
- 5610.7%Mobile Property/Vehicle Fires
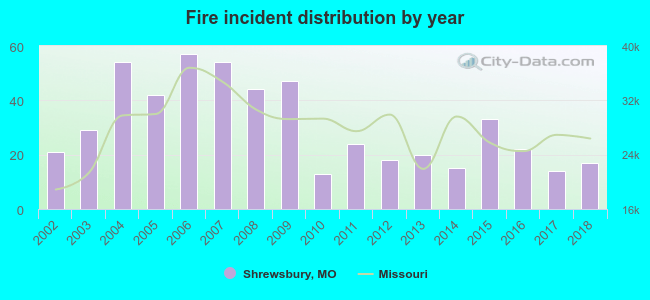 According to the data from the years 2002 - 2018 the average number of fires per year is 31. The highest number of reported fires - 57 took place in 2006, and the least - 13 in 2010. The data has a decreasing trend.
The average number of yearly fire incidents per 10k residents in Shrewsbury, MO compared to nearest cities:
(Note: Based on data for the last 3 years, including only cities with population 5,000 and above)
| Shrewsbury: | 28.5 |
| Webster Groves: | 24.9 |
| Maplewood: | 75.0 |
| Brentwood: | 51.4 |
| Affton: | 8.9 |
| Richmond Heights: | 78.9 |
| Glendale: | 11.3 |
| Crestwood: | 22.6 |
| Clayton: | 43.4 |
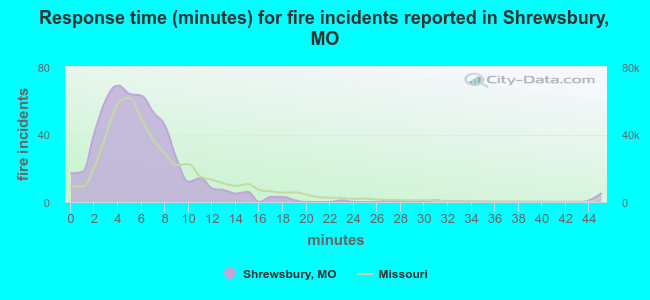 The median response time based on all reported fire incidents is 5 minutes. This is lower compared to the Missouri median value.
The median response time in Shrewsbury, MO compared to nearest cities:
(Note: Based on data for all years, including only cities with at least 500 fire incidents)
| Shrewsbury: | 5 minutes |
| Webster Groves: | 5 minutes |
| Maplewood: | 4 minutes |
| Brentwood: | 4 minutes |
| Affton: | 5 minutes |
| Richmond Heights: | 5 minutes |
| Crestwood: | 4 minutes |
| Clayton: | 4 minutes |
| Lemay: | 6 minutes |
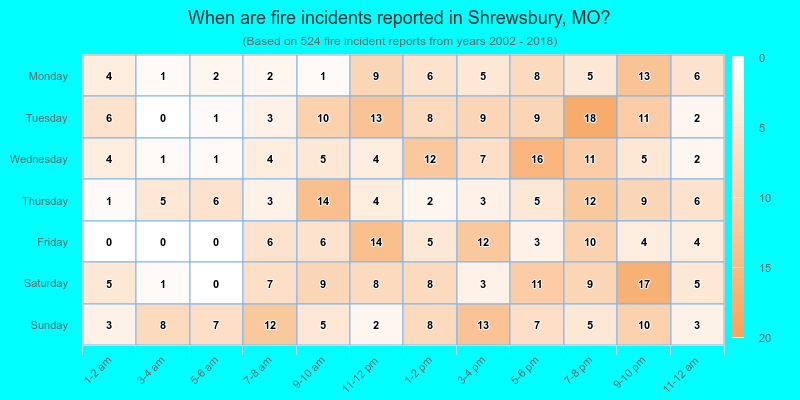
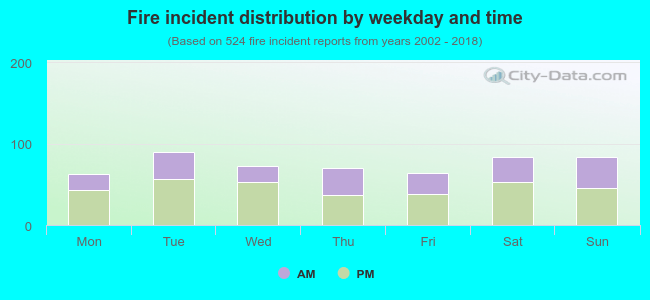 37.6% incidents where reported in the morning and 62.4% in the evening. The most fires (17.2%) took place on Tuesday, and the least (11.8%) on Monday.
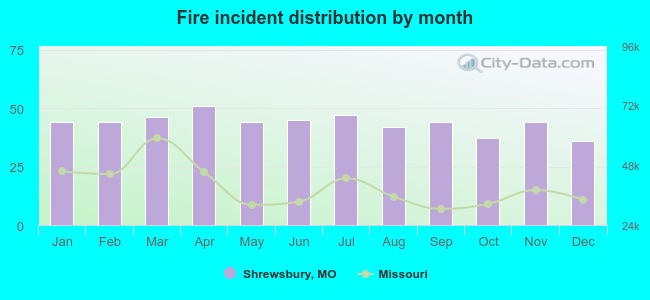 According to the 524 fires from years 2002 - 2018 most fires (9.7%) took place during April, and the least (6.9%) in December.
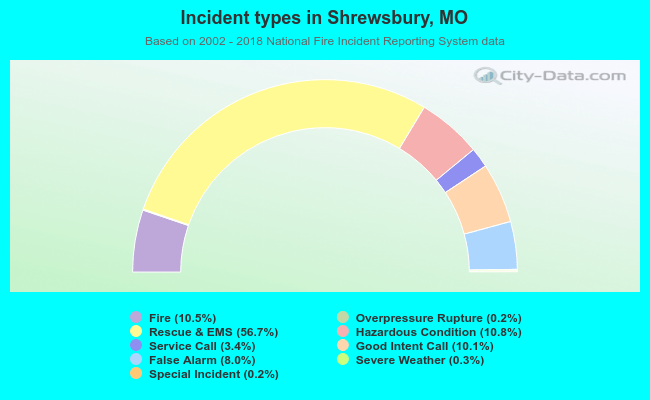 Out of all 5,014 cases reported during the years 2002 - 2018, the most belonged to the categories: Rescue & EMS (56.7%), Hazardous Condition (10.8%), and Fire (10.5%).
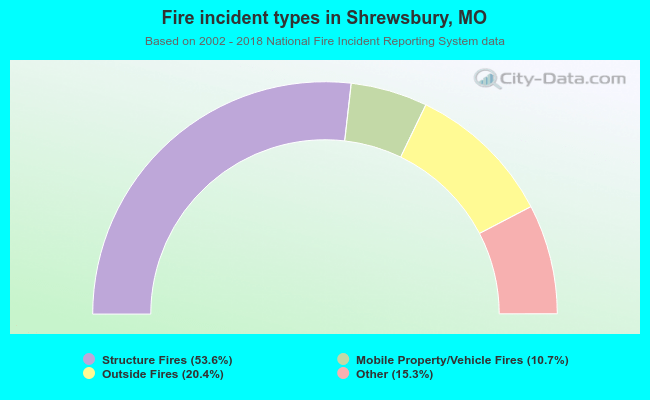 When looking into fire subcategories, the most reports belonged to: Structure Fires (53.6%), and Outside Fires (20.4%).