Silverdale: Fire Incidents, Washington (WA)
Where are fire incidents reported in Silverdale, WA
Something went wrong! Please refresh the page.
| Fire incidents reported | |
|---|---|
| Sreet name | Count |
| SILVERDALE WAY | 268 |
| BUCKLIN HILL RD | 98 |
| RIDGETOP BLVD | 68 |
| ANDERSON HILL RD | 54 |
| NEWBERRY HILL RD | 52 |
| RANDALL WAY | 50 |
| DICKEY RD | 48 |
| MYHRE RD | 42 |
| CLEAR CREEK RD | 34 |
| MICKELBERRY RD | 28 |
| MOUNT VINTAGE WAY | 26 |
| OLD FRONTIER RD | 26 |
| MOUNTAIN VIEW RD | 24 |
| KITSAP MALL BLVD | 20 |
| OLYMPIC VIEW RD | 20 |
| SILVERDALE | 18 |
| STATE HWY 3 | 18 |
| WASHINGTON AVE | 18 |
| CHICO WAY | 16 |
| DAPHNE LANE | 16 |
| HILLSBORO DR | 16 |
| HWY 3 | 16 |
| PRINCETON LANE | 16 |
| SHIPSIDE LANE | 16 |
| BAY SHORE DR | 14 |
| SANTA FE LANE | 14 |
| SILVERDALE LOOP RD | 14 |
| WAAGA WAY | 14 |
| HIGH SIERRA LANE | 12 |
| KENSINGTON LANE | 12 |
2003 - 2018 National Fire Incident Reporting System (NFIRS) incidents
- Incident types reported to NFIRS in Silverdale, WA
- 8,42056.6%Rescue & EMS
- 2,16314.5%Service Call
- 1,2818.6%Good Intent Call
- 1,0256.9%Fire
- 9236.2%Hazardous Condition
- 8886.0%False Alarm
- 1621.1%Special Incident
- 190.1%Overpressure Rupture
- Fire incident types reported to NFIRS in Silverdale, WA
- 45844.7%Outside Fires
- 35734.8%Structure Fires
- 20620.1%Mobile Property/Vehicle Fires
- 40.4%Other
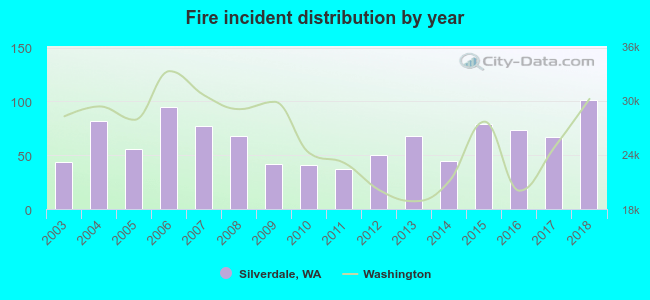 According to the data from the years 2003 - 2018 the average number of fires per year is 64. The highest number of fire incidents - 101 took place in 2018, and the least - 37 in 2011. The data has an increasing trend.
The average number of yearly fire incidents per 10k residents in Silverdale, WA compared to nearest cities:
(Note: Based on data for the last 3 years, including only cities with population 5,000 and above)
| Silverdale: | 41.8 |
| Poulsbo: | 74.6 |
| Bremerton: | 80.3 |
| Bainbridge Island: | 19.9 |
| Port Orchard: | 133.7 |
| Manchester: | 1.8 |
| Seattle: | 33.2 |
| Shoreline: | 23.4 |
| Edmonds: | 16.5 |
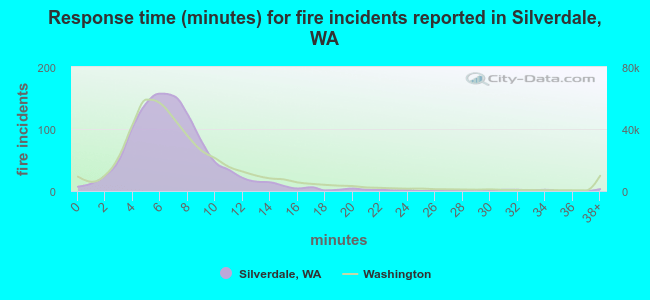 The median response time based on all reported fire incidents is 7 minutes. This is close to the state median value.
The median response time in Silverdale, WA compared to nearest cities:
(Note: Based on data for all years, including only cities with at least 500 fire incidents)
| Silverdale: | 7 minutes |
| Poulsbo: | 8 minutes |
| Bremerton: | 6 minutes |
| Bainbridge Island: | 7 minutes |
| Port Orchard: | 8 minutes |
| Quilcene: | 13 minutes |
| Seattle: | 5 minutes |
| Shoreline: | 7 minutes |
| Edmonds: | 7 minutes |
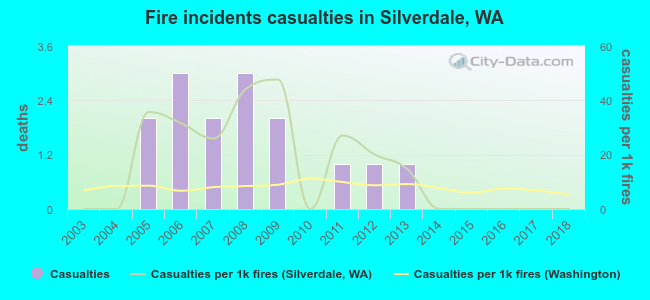 According to the data from the years 2003 - 2018 the average number of fire-related yearly casualties is 1. The highest number of reported injuries - 3 took place in 2006, and the lowest - 0 in 2003. The data has a constant trend.
The average number of injuries per 1,000 fire incidents is 15. This indicator was the highest - 48 in 2009, and the lowest 0 in 2003. The trend for injuries per 1,000 fire incidents is decreasing. Compared to the state value the number of injuries per 1,000 fire incidents is higher.
According to the data from the years 2003 - 2018 the average number of fire-related yearly casualties is 1. The highest number of reported injuries - 3 took place in 2006, and the lowest - 0 in 2003. The data has a constant trend.
The average number of injuries per 1,000 fire incidents is 15. This indicator was the highest - 48 in 2009, and the lowest 0 in 2003. The trend for injuries per 1,000 fire incidents is decreasing. Compared to the state value the number of injuries per 1,000 fire incidents is higher.Casualties per 1,000 incidents in Silverdale, WA compared to nearest cities:
(Note: Based on data for all years, including only cities with at least 500 fire incidents)
| Silverdale: | 14.6 |
| Poulsbo: | 6.0 |
| Bremerton: | 18.6 |
| Bainbridge Island: | 17.7 |
| Port Orchard: | 28.1 |
| Quilcene: | 0.0 |
| Seattle: | 9.1 |
| Shoreline: | 19.2 |
| Edmonds: | 13.1 |
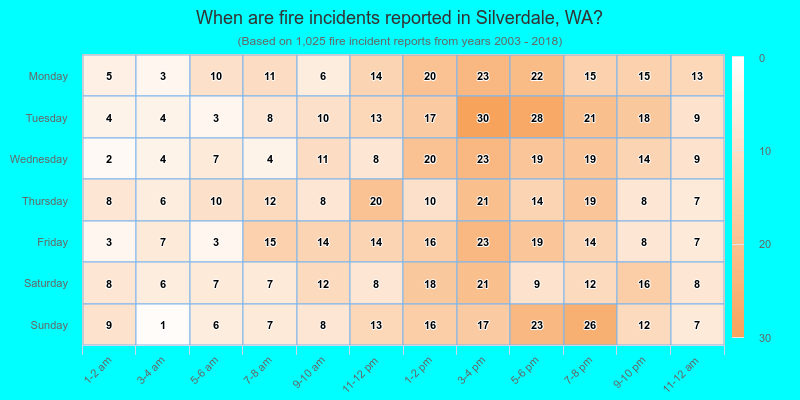
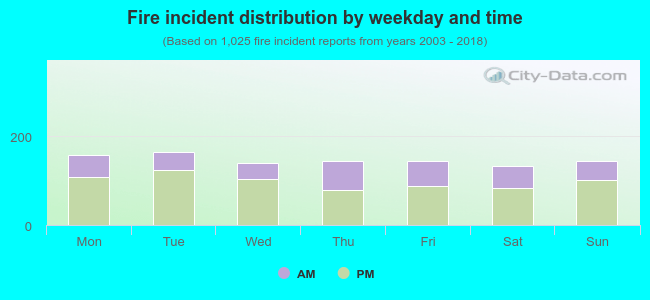 33.1% incidents where reported in the morning and 66.9% in the evening. The most fires (16.1%) took place on Tuesday, and the least (12.9%) on Saturday.
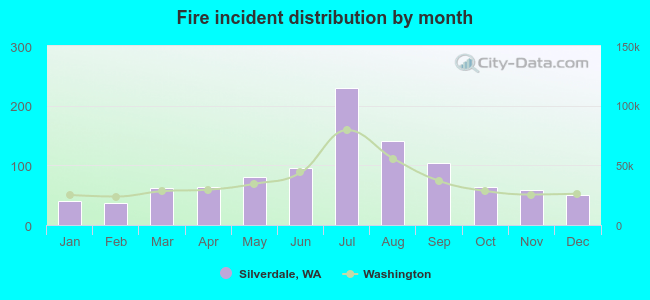 According to the 1,025 fires from years 2003 - 2018 most fires (22.3%) took place during July, and the least (3.6%) in February.
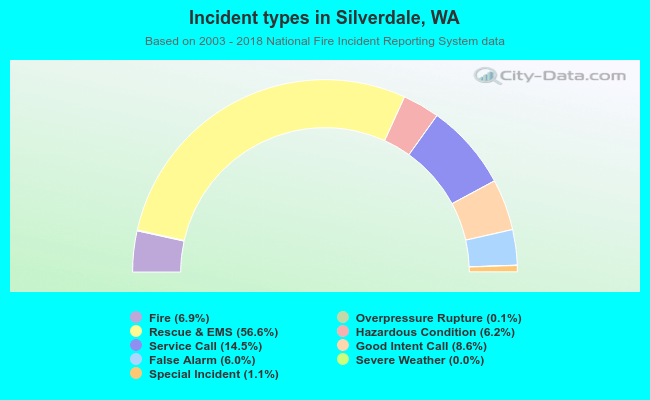 Out of all 14,885 cases reported during the years 2003 - 2018, the most belonged to the categories: Rescue & EMS (56.6%), Service Call (14.5%), and Good Intent Call (8.6%).
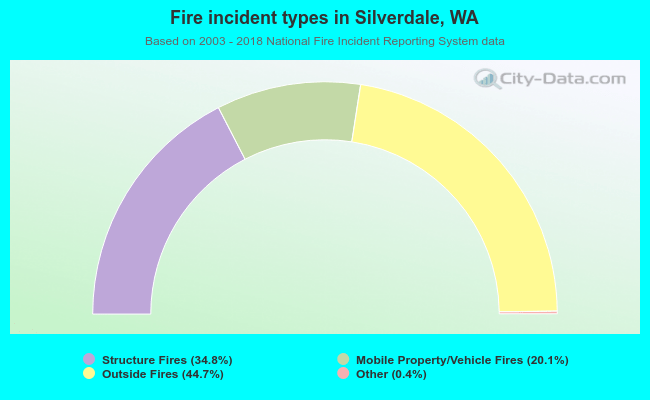 When looking into fire subcategories, the most reports belonged to: Outside Fires (44.7%), and Structure Fires (34.8%).