Bainbridge Island: Fire Incidents, Washington (WA)
Where are fire incidents reported in Bainbridge Island, WA
Something went wrong! Please refresh the page.
| Fire incidents reported | |
|---|---|
| Sreet name | Count |
| MADISON AVE | 102 |
| HIGH SCHOOL RD | 82 |
| WINSLOW WAY | 50 |
| SUNRISE DR | 44 |
| FLETCHER BAY RD | 34 |
| ARROW POINT DR | 32 |
| DAY RD | 32 |
| MILLER RD | 30 |
| CRYSTAL SPRINGS DR | 26 |
| EAGLE HARBOR DR | 24 |
| PARFITT WAY | 24 |
| POINT WHITE DR | 22 |
| SPRINGRIDGE RD | 20 |
| PLEASANT BEACH DR | 18 |
| BLAKELY AVE | 16 |
| LYNWOOD CENTER RD | 16 |
| MANZANITA RD | 16 |
| OLD MILL RD | 16 |
| SHANNON DR | 16 |
| FERNCLIFF AVE | 14 |
| KNECHTEL WAY | 14 |
| MANITOU BEACH DR | 14 |
| NORTH MADISON AVE | 14 |
| PHELPS RD | 14 |
| SPORTSMAN CLUB RD | 14 |
| AGATE PASS RD | 12 |
| BAKER HILL RD | 12 |
| HIDDEN COVE RD | 12 |
| MADISON AVE N | 12 |
| MADRONA WAY | 12 |
| Other | 83 |
2002 - 2018 National Fire Incident Reporting System (NFIRS) incidents
- Incident types reported to NFIRS in Bainbridge Island, WA
- 8,48856.5%Rescue & EMS
- 1,60010.6%Hazardous Condition
- 1,4519.7%Good Intent Call
- 1,2568.4%False Alarm
- 1,2398.2%Service Call
- 8475.6%Fire
- 820.5%Overpressure Rupture
- 410.3%Severe Weather
- 220.1%Special Incident
- Fire incident types reported to NFIRS in Bainbridge Island, WA
- 39947.1%Structure Fires
- 29835.2%Outside Fires
- 11813.9%Mobile Property/Vehicle Fires
- 323.8%Other
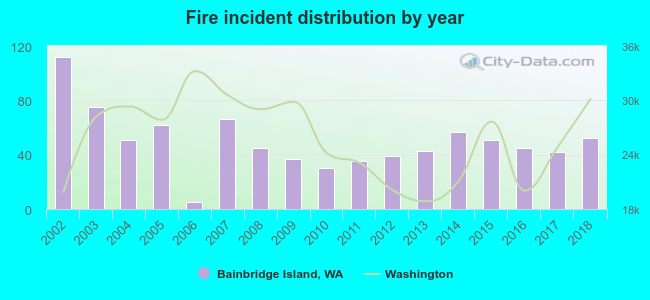 According to the data from the years 2002 - 2018 the average number of fire incidents per year is 50. The highest number of reported fire incidents - 112 took place in 2002, and the least - 5 in 2006. The data has a decreasing trend.
The average number of yearly fire incidents per 10k residents in Bainbridge Island, WA compared to nearest cities:
(Note: Based on data for the last 3 years, including only cities with population 5,000 and above)
| Bainbridge Island: | 19.9 |
| Silverdale: | 41.8 |
| Manchester: | 1.8 |
| Poulsbo: | 74.6 |
| Bremerton: | 80.3 |
| Seattle: | 33.2 |
| Port Orchard: | 133.7 |
| Shoreline: | 23.4 |
| Edmonds: | 16.5 |
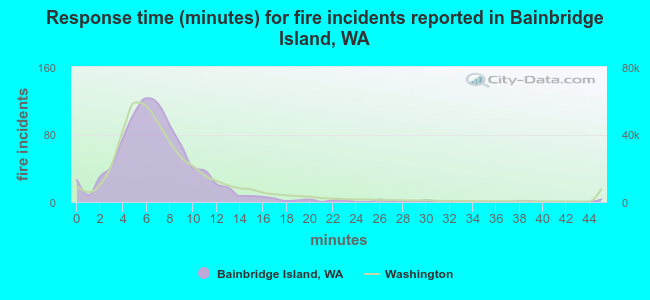 The median response time based on all reported fire incidents is 7 minutes. This is about the same as the state median value.
The median response time in Bainbridge Island, WA compared to nearest cities:
(Note: Based on data for all years, including only cities with at least 500 fire incidents)
| Bainbridge Island: | 7 minutes |
| Silverdale: | 7 minutes |
| Poulsbo: | 8 minutes |
| Bremerton: | 6 minutes |
| Seattle: | 5 minutes |
| Port Orchard: | 8 minutes |
| Shoreline: | 7 minutes |
| Edmonds: | 7 minutes |
| Mountlake Terrace: | 7 minutes |
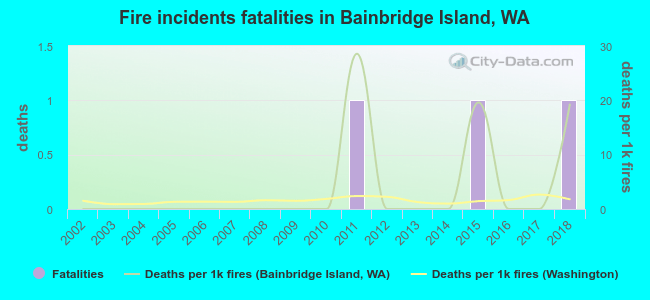 According to the data from the years 2002 - 2018 the average number of fire-related fatalities per year is 0. The highest number of deaths - 1 took place in 2011, and the lowest - 0 in 2002. The data has a growing trend.
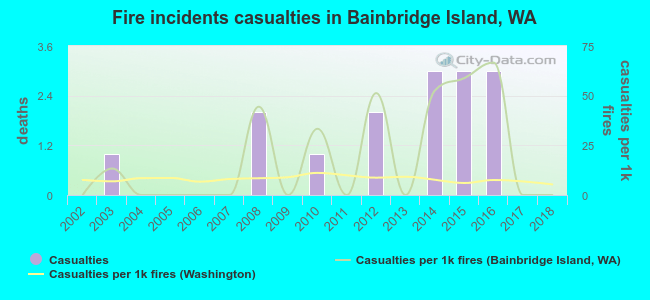 According to the data from the years 2002 - 2018 the average number of fire-related yearly casualties is 1. The highest number of reported casualties - 3 took place in 2014, and the lowest - 0 in 2002. The data has a constant trend.
The average number of injuries per 1,000 fire incidents is 19. This indicator was the highest - 67 in 2016, and the lowest 0 in 2002. The trend for injuries per 1,000 fire incidents is decreasing. Compared to the Washington value the number of casualties per 1,000 fire incidents is much higher.
According to the data from the years 2002 - 2018 the average number of fire-related yearly casualties is 1. The highest number of reported casualties - 3 took place in 2014, and the lowest - 0 in 2002. The data has a constant trend.
The average number of injuries per 1,000 fire incidents is 19. This indicator was the highest - 67 in 2016, and the lowest 0 in 2002. The trend for injuries per 1,000 fire incidents is decreasing. Compared to the Washington value the number of casualties per 1,000 fire incidents is much higher.Casualties per 1,000 incidents in Bainbridge Island, WA compared to nearest cities:
(Note: Based on data for all years, including only cities with at least 500 fire incidents)
| Bainbridge Island: | 17.7 |
| Silverdale: | 14.6 |
| Poulsbo: | 6.0 |
| Bremerton: | 18.6 |
| Seattle: | 9.1 |
| Port Orchard: | 28.1 |
| Shoreline: | 19.2 |
| Edmonds: | 13.1 |
| Mountlake Terrace: | 13.9 |
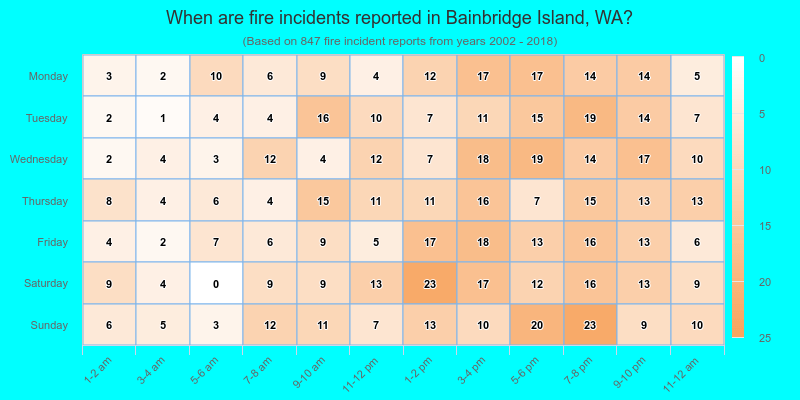
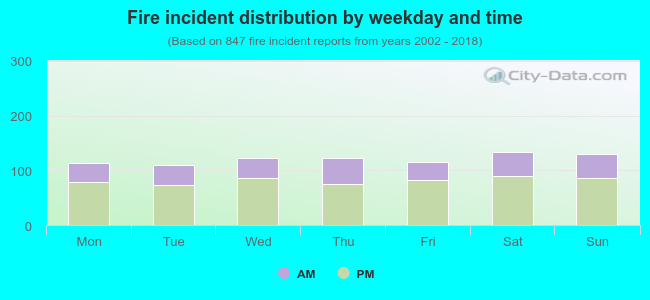 32.7% incidents where reported in the morning and 67.3% in the evening. The most fires (15.8%) took place on Saturday, and the least (13.0%) on Tuesday.
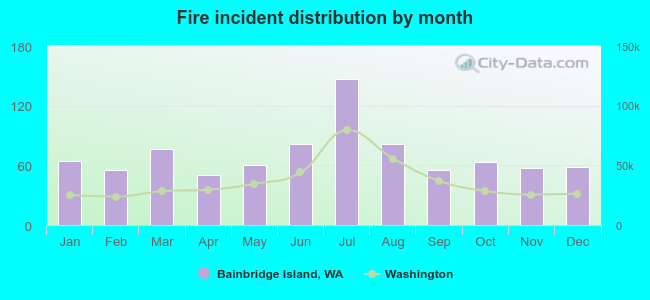 According to the 847 incident reports from years 2002 - 2018 most fires (17.4%) took place during July, and the least (5.9%) in April.
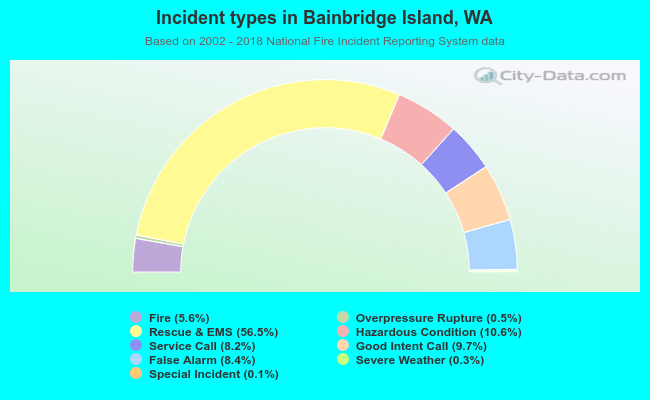 Out of all 15,026 cases reported during the years 2002 - 2018, the most belonged to the categories: Rescue & EMS (56.5%), Hazardous Condition (10.6%), and Good Intent Call (9.7%).
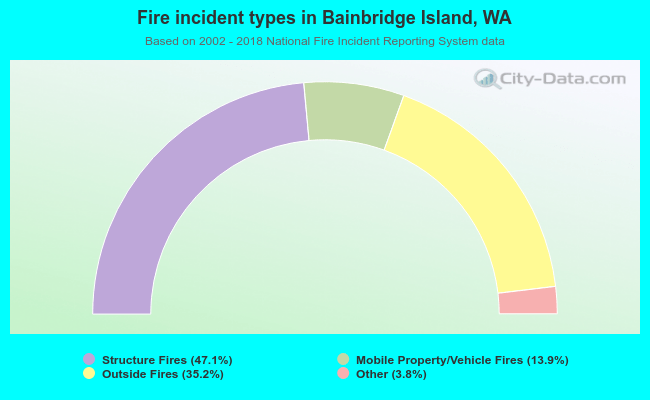 When looking into fire subcategories, the most incidents belonged to: Structure Fires (47.1%), and Outside Fires (35.2%).