Sioux Center: Fire Incidents, Iowa (IA)
Where are fire incidents reported in Sioux Center, IA
Something went wrong! Please refresh the page.
|
| |||||||||||||||||||||||||||||||||||||||||||||||||||||||||||||||||||||||||||||||||||||||||||||||||||||||||||||
2002 - 2018 National Fire Incident Reporting System (NFIRS) incidents
- Incident types reported to NFIRS in Sioux Center, IA
- 28540.0%Fire
- 20829.2%False Alarm
- 10815.1%Rescue & EMS
- 649.0%Good Intent Call
- 253.5%Hazardous Condition
- 142.0%Service Call
- 91.3%Severe Weather
- Fire incident types reported to NFIRS in Sioux Center, IA
- 11038.6%Outside Fires
- 8730.5%Structure Fires
- 6221.8%Mobile Property/Vehicle Fires
- 269.1%Other
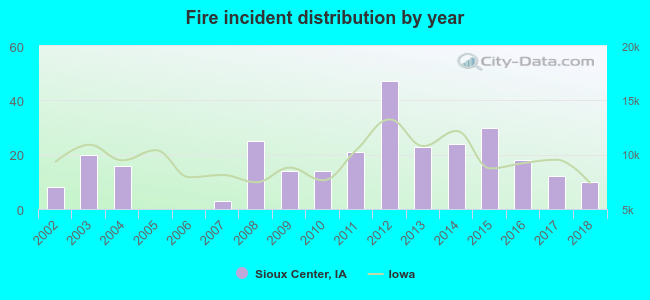 Based on the data from the years 2002 - 2018 the average number of fire incidents per year is 17. The highest number of fire incidents - 47 took place in 2012, and the least - 0 in 2005. The data has a growing trend.
The average number of yearly fire incidents per 10k residents in Sioux Center, IA compared to nearest cities:
(Note: Based on data for the last 3 years, including only cities with population 5,000 and above)
| Sioux Center: | 18.0 |
| Orange City: | 23.3 |
| Sheldon: | 45.0 |
| Le Mars: | 29.0 |
| Cherokee: | 22.7 |
| Sioux City: | 25.3 |
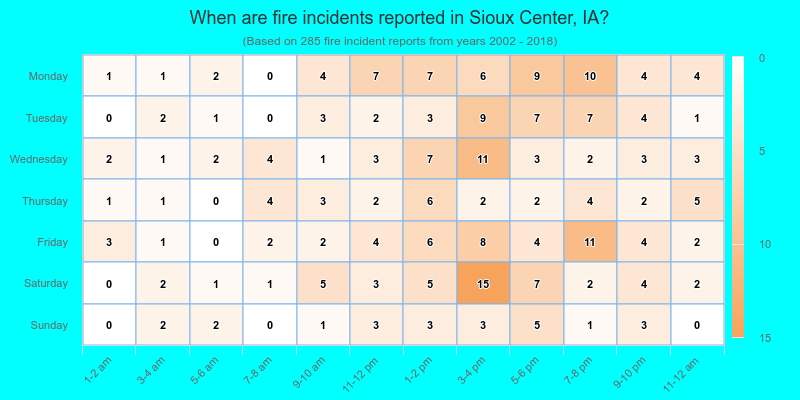
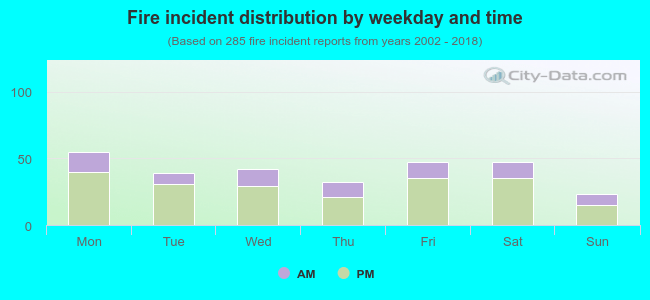 27.7% incidents where reported in the morning and 72.3% in the evening. The most fires (19.3%) took place on Monday, and the least (8.1%) on Sunday.
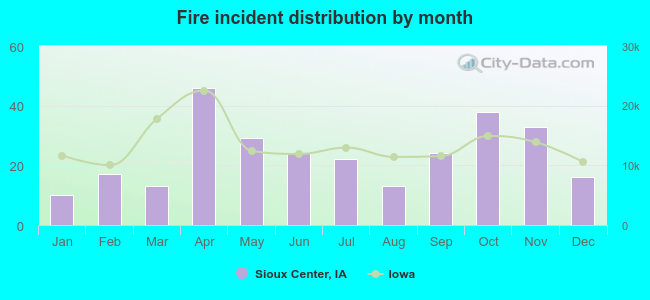 Based on the 285 fire incident reports from years 2002 - 2018 most fires (16.1%) took place during April, and the least (3.5%) in January.
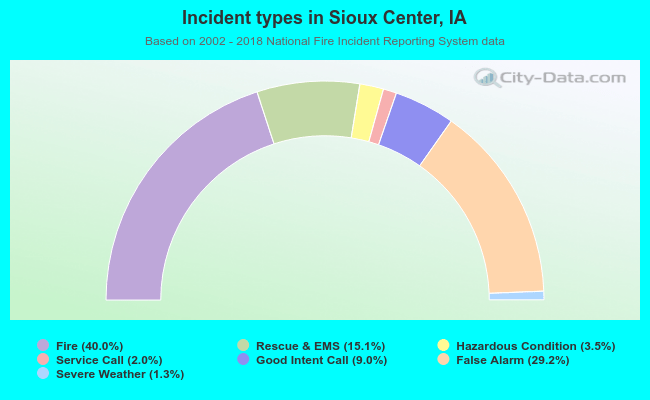 Out of all 713 cases reported during the years 2002 - 2018, the most belonged to the categories: Fire (40.0%), Good Intent Call (29.2%), and Overpressure Rupture (15.1%).
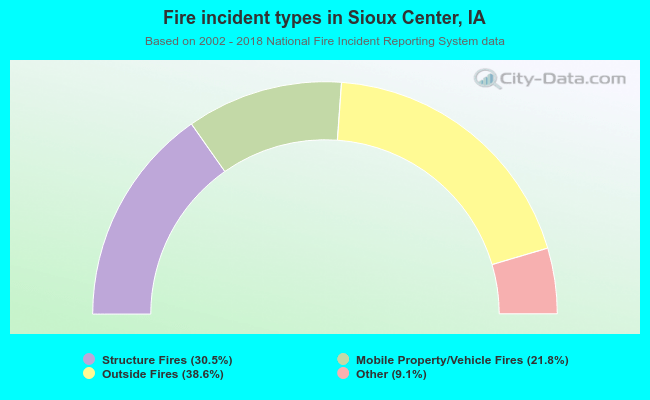 When looking into fire subcategories, the most reports belonged to: Outside Fires (38.6%), and Structure Fires (30.5%).