Sioux City: Fire Incidents, Iowa (IA)
Where are fire incidents reported in Sioux City, IA
Something went wrong! Please refresh the page.
| Fire incidents reported | |
|---|---|
| Sreet name | Count |
| PIERCE ST | 252 |
| NEBRASKA ST | 206 |
| GORDON DR | 194 |
| DOUGLAS ST | 184 |
| JACKSON ST | 164 |
| 4TH ST | 140 |
| 28TH ST | 138 |
| 14TH ST | 136 |
| COURT ST | 126 |
| 3RD ST | 122 |
| JONES ST | 116 |
| MORNINGSIDE AVE | 116 |
| 19TH ST | 112 |
| HAMILTON BLVD | 104 |
| 11TH ST | 98 |
| REBECCA ST | 98 |
| FLOYD BLVD | 96 |
| 04TH ST | 88 |
| 13TH ST | 88 |
| I29 N | 86 |
| RIVERSIDE BLVD | 86 |
| LEWIS BLVD | 84 |
| SINGING HILLS BLVD | 82 |
| JENNINGS ST | 76 |
| GRANDVIEW BLVD | 74 |
| RUSTIN ST | 72 |
| SERGEANT RD | 72 |
| 6TH ST | 66 |
| 5TH ST | 64 |
| 16TH ST | 62 |
| Other | 1,014 |
2002 - 2018 National Fire Incident Reporting System (NFIRS) incidents
- Incident types reported to NFIRS in Sioux City, IA
- 33,36067.1%Rescue & EMS
- 4,4168.9%Fire
- 4,0378.1%Hazardous Condition
- 3,1986.4%False Alarm
- 2,3774.8%Good Intent Call
- 2,1594.3%Service Call
- 1130.2%Overpressure Rupture
- Fire incident types reported to NFIRS in Sioux City, IA
- 1,83041.4%Structure Fires
- 1,62336.8%Outside Fires
- 93621.2%Mobile Property/Vehicle Fires
- 270.6%Other
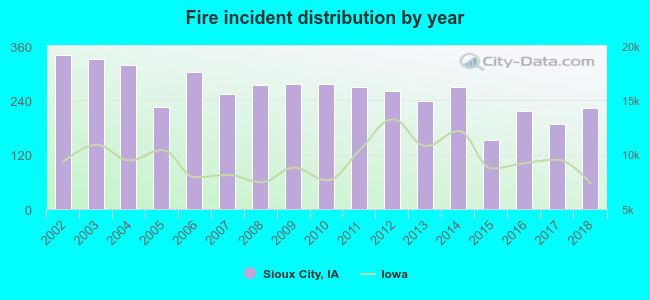 Based on the data from the years 2002 - 2018 the average number of fire incidents per year is 260. The highest number of fire incidents - 341 took place in 2002, and the least - 153 in 2015. The data has a dropping trend.
The average number of yearly fire incidents per 10k residents in Sioux City, IA compared to nearest cities:
(Note: Based on data for the last 3 years, including only cities with population 5,000 and above)
| Sioux City: | 25.3 |
| Le Mars: | 29.0 |
| Orange City: | 23.3 |
| Sioux Center: | 18.0 |
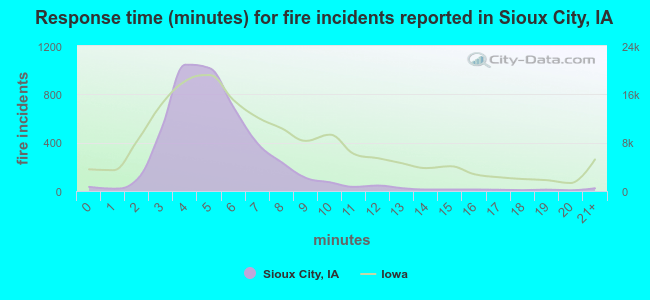 The median response time based on all reported fire incidents is 5 minutes. This is lower compared to the state median value.
The median response time in Sioux City, IA compared to nearest cities:
(Note: Based on data for all years, including only cities with at least 500 fire incidents)
| Sioux City: | 5 minutes |
| Le Mars: | 8 minutes |
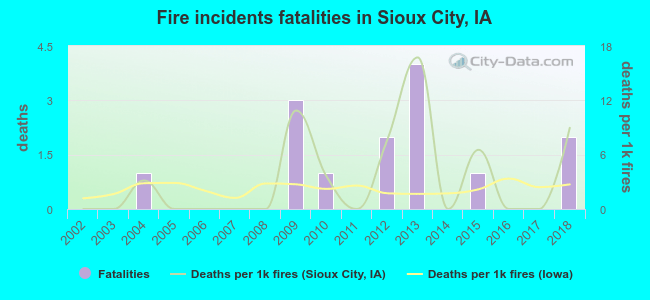 According to the reports from the years 2002 - 2018 the average number of fire-related fatalities per year is 1. The highest number of deaths - 4 took place in 2013, and the lowest - 0 in 2002. The data has a growing trend.
The average number of fatalities per 1,000 fires is 3. This indicator was the highest - 17 in 2013, and the lowest 0 in 2002. The trend for deaths per 1,000 incidents is growing. Compared to the state value the number of deaths per 1,000 fires is higher.
According to the reports from the years 2002 - 2018 the average number of fire-related fatalities per year is 1. The highest number of deaths - 4 took place in 2013, and the lowest - 0 in 2002. The data has a growing trend.
The average number of fatalities per 1,000 fires is 3. This indicator was the highest - 17 in 2013, and the lowest 0 in 2002. The trend for deaths per 1,000 incidents is growing. Compared to the state value the number of deaths per 1,000 fires is higher.Deaths per 1,000 incidents in Sioux City, IA compared to nearest cities:
(Note: Based on data for all years, including only cities with at least 2,500 fire incidents)
| Sioux City: | 3.2 |
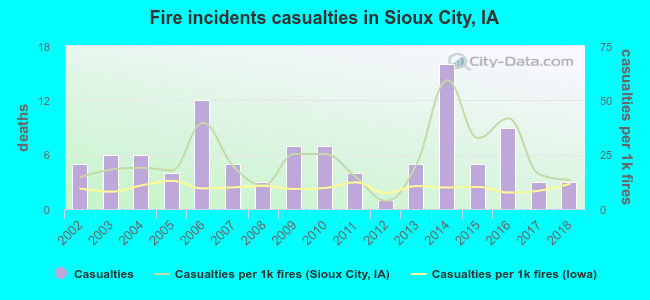 According to the data from the years 2002 - 2018 the average number of fire-related casualties per year is 6. The highest number of reported injuries - 16 took place in 2014, and the lowest - 1 in 2012. The data has a decreasing trend.
The average number of injuries per 1,000 fire incidents is 23. This indicator was the highest - 59 in 2014, and the lowest 4 in 2012. The trend for injuries per 1,000 fires is decreasing. Compared to the state value the number of casualties per 1,000 fire incidents is much higher.
According to the data from the years 2002 - 2018 the average number of fire-related casualties per year is 6. The highest number of reported injuries - 16 took place in 2014, and the lowest - 1 in 2012. The data has a decreasing trend.
The average number of injuries per 1,000 fire incidents is 23. This indicator was the highest - 59 in 2014, and the lowest 4 in 2012. The trend for injuries per 1,000 fires is decreasing. Compared to the state value the number of casualties per 1,000 fire incidents is much higher.Casualties per 1,000 incidents in Sioux City, IA compared to nearest cities:
(Note: Based on data for all years, including only cities with at least 500 fire incidents)
| Sioux City: | 22.9 |
| Le Mars: | 15.1 |
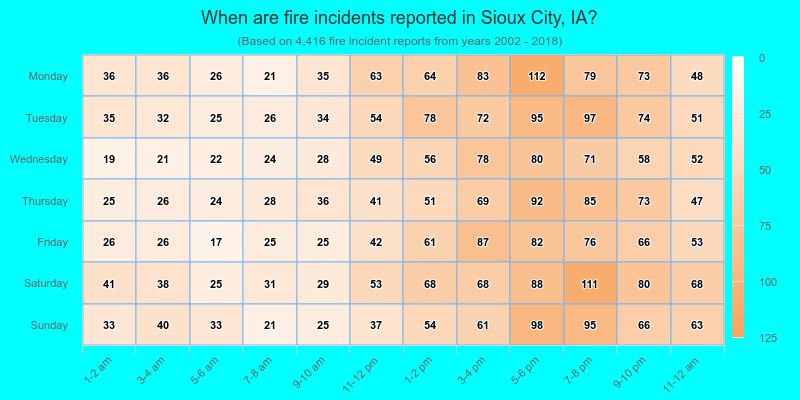
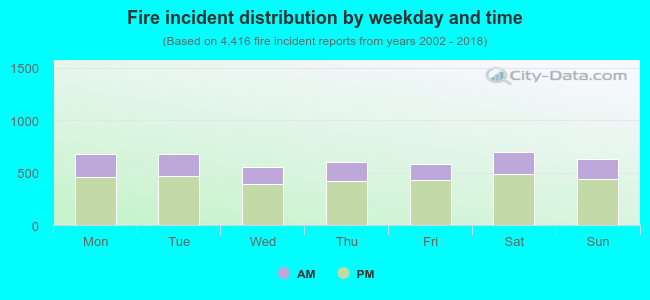 30.2% incidents where reported in the morning and 69.8% in the evening. The most fires (15.9%) took place on Saturday, and the least (12.6%) on Wednesday.
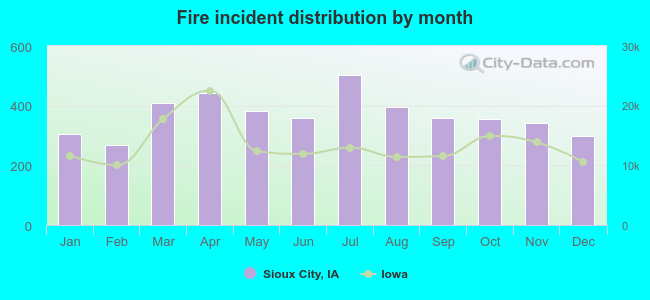 Based on the 4,416 reports from years 2002 - 2018 most fires (11.4%) took place during July, and the least (6.1%) in February.
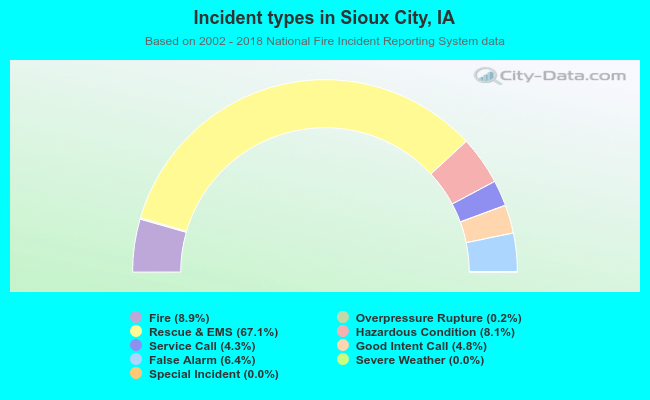 Out of all 49,681 cases reported during the years 2002 - 2018, the most belonged to the categories: Rescue & EMS (67.1%), Fire (8.9%), and Hazardous Condition (8.1%).
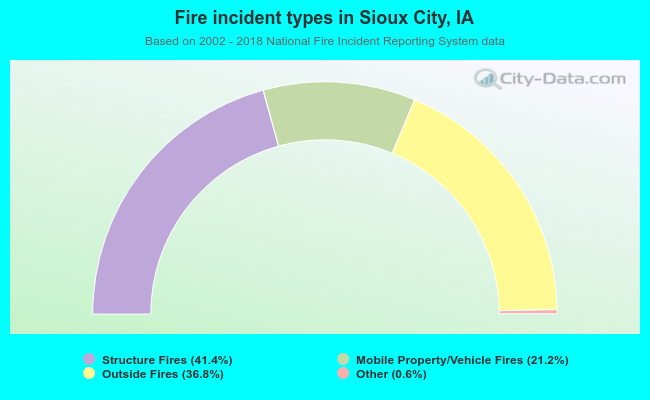 When looking into fire subcategories, the most reports belonged to: Structure Fires (41.4%), and Outside Fires (36.8%).