Smiths: Fire Incidents, Alabama (AL)
Where are fire incidents reported in Smiths, AL
Something went wrong! Please refresh the page.
|
| |||||||||||||||||||||||||||||||||||||||||||||||||||||||||||||||||||||||||||||||||||||||||||||||||||||||||||||
2003 - 2018 National Fire Incident Reporting System (NFIRS) incidents
- Incident types reported to NFIRS in Smiths, AL
- 2,84374.5%Rescue & EMS
- 50513.2%Fire
- 1975.2%False Alarm
- 852.2%Service Call
- 651.7%Good Intent Call
- 611.6%Hazardous Condition
- 350.9%Special Incident
- 250.7%Severe Weather
- Fire incident types reported to NFIRS in Smiths, AL
- 23045.5%Outside Fires
- 12324.4%Structure Fires
- 9318.4%Other
- 5911.7%Mobile Property/Vehicle Fires
 Based on the data from the years 2003 - 2018 the average number of fire incidents per year is 32. The highest number of reported fires - 162 took place in 2011, and the least - 0 in 2004. The data has a growing trend.
The average number of yearly fire incidents per 10k residents in Smiths, AL compared to nearest cities:
(Note: Based on data for the last 3 years, including only cities with population 5,000 and above)
| Smiths: | 13.9 |
| Smiths Station: | 80.0 |
| Phenix City: | 37.5 |
| Beulah: | 1.6 |
| Opelika: | 39.8 |
| Valley: | 43.0 |
| Auburn: | 24.6 |
| Lanett: | 69.8 |
| Roanoke: | 32.7 |
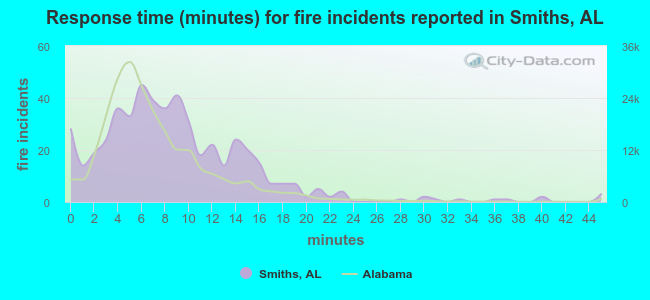 The median response time based on all reported fire incidents is 8 minutes. This is higher than the Alabama median value.
The median response time in Smiths, AL compared to nearest cities:
(Note: Based on data for all years, including only cities with at least 500 fire incidents)
| Smiths: | 8 minutes |
| Phenix City: | 4 minutes |
| Opelika: | 4 minutes |
| Valley: | 6 minutes |
| Auburn: | 5 minutes |
| Dadeville: | 11 minutes |
| Roanoke: | 5 minutes |
| Eufaula: | 6 minutes |
| Tallassee: | 10 minutes |
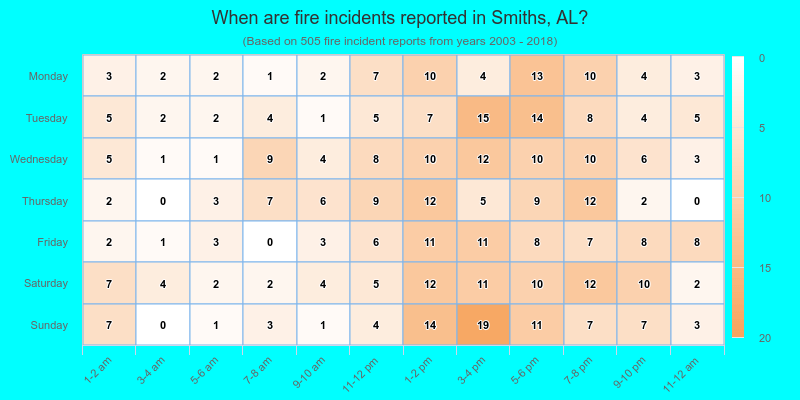
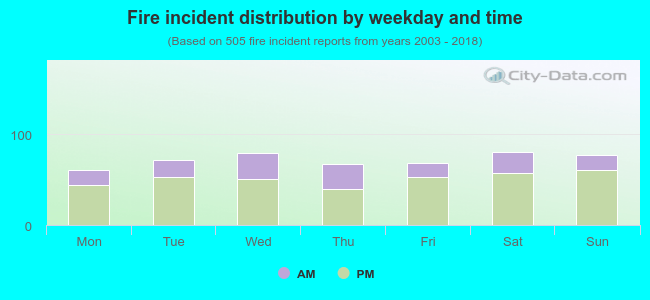 28.9% incidents where reported in the morning and 71.1% in the evening. The most fires (16.0%) took place on Saturday, and the least (12.1%) on Monday.
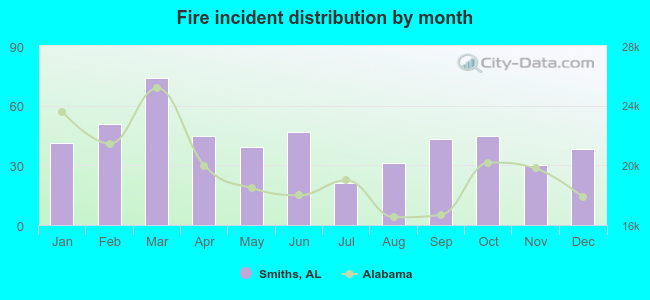 Based on the 505 fire incidents from years 2003 - 2018 most fires (14.7%) took place during March, and the least (4.2%) in July.
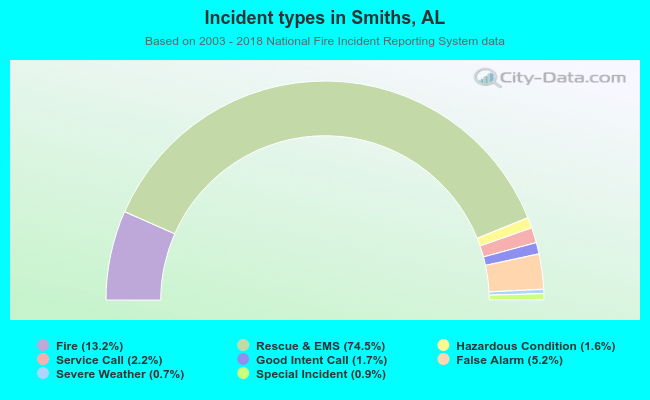 Out of all 3,816 cases reported during the years 2003 - 2018, the most belonged to the categories: Overpressure Rupture (74.5%), Fire (13.2%), and Good Intent Call (5.2%).
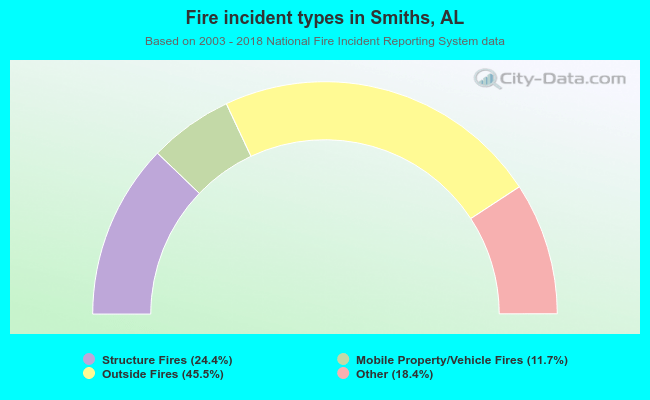 When looking into fire subcategories, the most incidents belonged to: Outside Fires (45.5%), and Structure Fires (24.4%).