Smiths Station: Fire Incidents, Alabama (AL)
Where are fire incidents reported in Smiths Station, AL
Something went wrong! Please refresh the page.
|
| |||||||||||||||||||||||||||||||||||||||||||||||||||||||||||||||||||||||||||||||||||||||||||||||||||||||||||||
2007 - 2018 National Fire Incident Reporting System (NFIRS) incidents
- Incident types reported to NFIRS in Smiths Station, AL
- 2,17378.7%Rescue & EMS
- 2749.9%Fire
- 1304.7%False Alarm
- 552.0%Good Intent Call
- 542.0%Service Call
- 291.1%Hazardous Condition
- 250.9%Special Incident
- 190.7%Severe Weather
- Fire incident types reported to NFIRS in Smiths Station, AL
- 11542.0%Outside Fires
- 8832.1%Other
- 4215.3%Structure Fires
- 2910.6%Mobile Property/Vehicle Fires
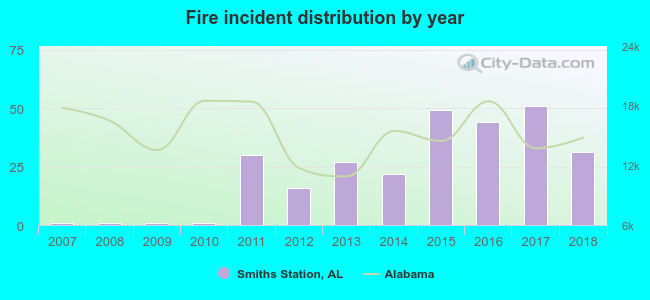 Based on the data from the years 2007 - 2018 the average number of fire incidents per year is 23. The highest number of reported fires - 51 took place in 2017, and the least - 1 in 2007. The data has a growing trend.
The average number of yearly fire incidents per 10k residents in Smiths Station, AL compared to nearest cities:
(Note: Based on data for the last 3 years, including only cities with population 5,000 and above)
| Smiths Station: | 80.0 |
| Smiths: | 13.9 |
| Phenix City: | 37.5 |
| Beulah: | 1.6 |
| Opelika: | 39.8 |
| Valley: | 43.0 |
| Auburn: | 24.6 |
| Lanett: | 69.8 |
| Roanoke: | 32.7 |

 27.7% incidents where reported in the morning and 72.3% in the evening. The most fires (17.5%) took place on Tuesday, and the least (8.4%) on Friday.
 According to the 274 reports from years 2007 - 2018 most fires (10.6%) took place during January, and the least (5.5%) in June.
 Out of all 2,760 cases reported during the years 2007 - 2018, the most belonged to the categories: Rescue & EMS (78.7%), Fire (9.9%), and False Alarm (4.7%).
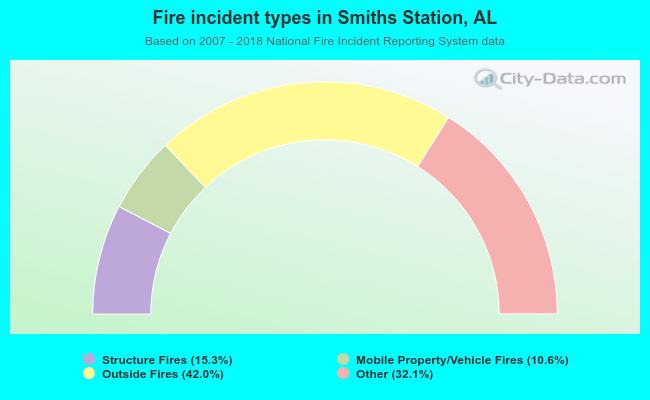 When looking into fire subcategories, the most incidents belonged to: Outside Fires (42.0%), and Other (32.1%).