De Witt: Fire Incidents, New York (NY)
Where are fire incidents reported in De Witt, NY
Something went wrong! Please refresh the page.
|
| |||||||||||||||||||||||||||||||||||||||||||||||||||||||||||||||||||||||||||||||||||||||||||||||||||||||||||||
2008 - 2018 National Fire Incident Reporting System (NFIRS) incidents
- Incident types reported to NFIRS in De Witt, NY
- 2,40954.3%Rescue & EMS
- 62514.1%False Alarm
- 45210.2%Service Call
- 3738.4%Good Intent Call
- 3056.9%Hazardous Condition
- 2535.7%Fire
- 80.2%Severe Weather
- 70.2%Overpressure Rupture
- Fire incident types reported to NFIRS in De Witt, NY
- 19075.1%Structure Fires
- 4116.2%Outside Fires
- 228.7%Mobile Property/Vehicle Fires
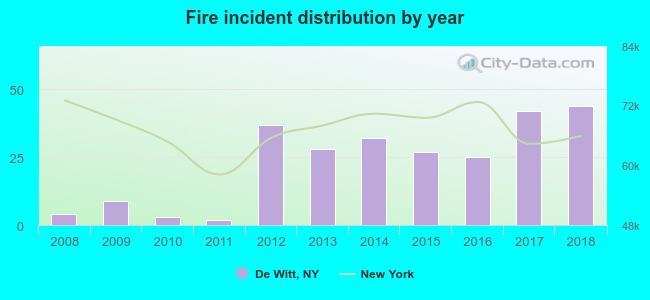 According to the data from the years 2008 - 2018 the average number of fire incidents per year is 23. The highest number of fires - 44 took place in 2018, and the least - 2 in 2011. The data has an increasing trend.
The average number of yearly fire incidents per 10k residents in De Witt, NY compared to nearest cities:
(Note: Based on data for the last 3 years, including only cities with population 5,000 and above)
| De Witt: | 14.3 |
| Syracuse: | 77.4 |
| Mattydale: | 63.1 |
| North Syracuse: | 96.9 |
| Solvay: | 38.7 |
| Onondaga: | 3.9 |
| Cicero: | 24.4 |
| Fairmount: | 1.0 |
| Clay: | 6.6 |

 25.7% incidents where reported in the morning and 74.3% in the evening. The most fires (20.2%) took place on Saturday, and the least (7.9%) on Tuesday.
 Based on the 253 reports from years 2008 - 2018 most fires (14.6%) took place during May, and the least (3.2%) in March.
 Out of all 4,434 cases reported during the years 2008 - 2018, the most belonged to the categories: Rescue & EMS (54.3%), False Alarm (14.1%), and Service Call (10.2%).
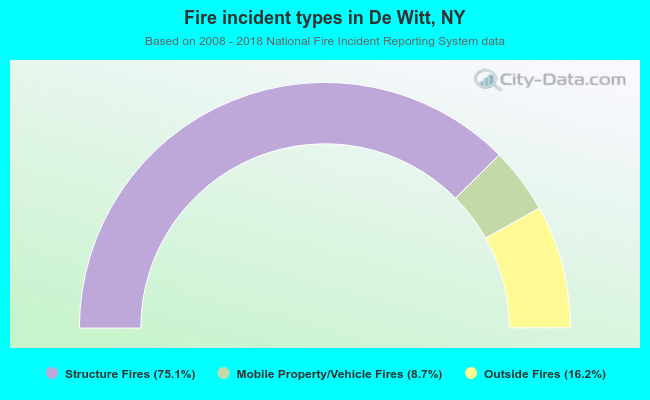 When looking into fire subcategories, the most incidents belonged to: Structure Fires (75.1%), and Outside Fires (16.2%).