Somerdale: Fire Incidents, New Jersey (NJ)
Where are fire incidents reported in Somerdale, NJ
Something went wrong! Please refresh the page.
|
| |||||||||||||||||||||||||||||||||||||||||||||||||||||||||||||||||||||||||||||||||||||||||||||||||||||||||||||
2003 - 2018 National Fire Incident Reporting System (NFIRS) incidents
- Incident types reported to NFIRS in Somerdale, NJ
- 98838.0%Hazardous Condition
- 51119.7%False Alarm
- 48518.7%Fire
- 29311.3%Good Intent Call
- 1827.0%Service Call
- 1315.0%Rescue & EMS
- 40.2%Special Incident
- 30.1%Overpressure Rupture
- Fire incident types reported to NFIRS in Somerdale, NJ
- 34270.5%Structure Fires
- 8216.9%Outside Fires
- 387.8%Other
- 234.7%Mobile Property/Vehicle Fires
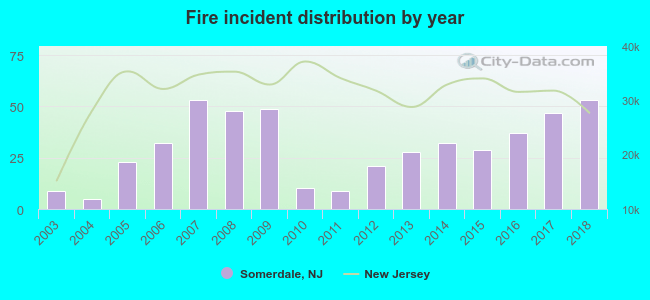 Based on the data from the years 2003 - 2018 the average number of fire incidents per year is 30. The highest number of reported fire incidents - 53 took place in 2007, and the least - 5 in 2004. The data has a rising trend.
The average number of yearly fire incidents per 10k residents in Somerdale, NJ compared to nearest cities:
(Note: Based on data for the last 3 years, including only cities with population 5,000 and above)
| Somerdale: | 85.5 |
| Stratford: | 51.4 |
| Lindenwold: | 36.9 |
| Barrington: | 61.0 |
| Runnemede: | 46.2 |
| Haddon Heights: | 29.4 |
| Haddonfield: | 26.9 |
| Bellmawr: | 51.2 |
| Audubon: | 35.6 |

 27.0% incidents where reported in the morning and 73.0% in the evening. The most fires (19.0%) took place on Wednesday, and the least (10.1%) on Sunday.
 According to the 485 incident reports from years 2003 - 2018 most fires (13.6%) took place during January, and the least (5.4%) in September.
 Out of all 2,598 cases reported during the years 2003 - 2018, the most belonged to the categories: Hazardous Condition (38.0%), False Alarm (19.7%), and Fire (18.7%).
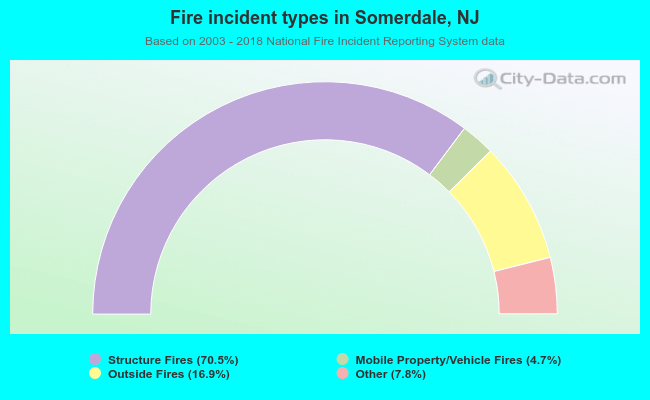 When looking into fire subcategories, the most incidents belonged to: Structure Fires (70.5%), and Outside Fires (16.9%).