Somers: Fire Incidents, Wisconsin (WI)
Where are fire incidents reported in Somers, WI
Something went wrong! Please refresh the page.
|
| |||||||||||||||||||||||||||||||||||||||||||||||||||||||||||||||||||||||||||||||||||||||||||||||||||||||||||||
2002 - 2018 National Fire Incident Reporting System (NFIRS) incidents
- Incident types reported to NFIRS in Somers, WI
- 46830.9%Hazardous Condition
- 42728.2%Rescue & EMS
- 30320.0%Fire
- 1419.3%Service Call
- 845.5%False Alarm
- 815.3%Good Intent Call
- 60.4%Severe Weather
- 30.2%Special Incident
- 20.1%Overpressure Rupture
- Fire incident types reported to NFIRS in Somers, WI
- 12240.3%Structure Fires
- 8327.4%Outside Fires
- 5016.5%Other
- 4815.8%Mobile Property/Vehicle Fires
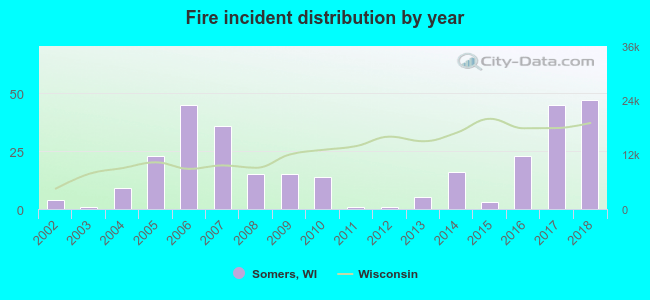 According to the data from the years 2002 - 2018 the average number of fires per year is 18. The highest number of reported fire incidents - 47 took place in 2018, and the least - 1 in 2003. The data has a rising trend.
The average number of yearly fire incidents per 10k residents in Somers, WI compared to nearest cities:
(Note: Based on data for the last 3 years, including only cities with population 5,000 and above)
| Somers: | 39.9 |
| Kenosha: | 23.0 |
| Sturtevant: | 43.0 |
| Pleasant Prairie: | 20.6 |
| Mount Pleasant: | 8.9 |
| Racine: | 33.7 |
| Caledonia: | 8.1 |
| Salem: | 27.3 |
| Oak Creek: | 30.0 |

 34.0% incidents where reported in the morning and 66.0% in the evening. The most fires (17.2%) took place on Saturday, and the least (10.6%) on Sunday.
 According to the 303 reports from years 2002 - 2018 most fires (12.5%) took place during May, and the least (3.6%) in September.
 Out of all 1,515 cases reported during the years 2002 - 2018, the most belonged to the categories: Hazardous Condition (30.9%), Rescue & EMS (28.2%), and Fire (20.0%).
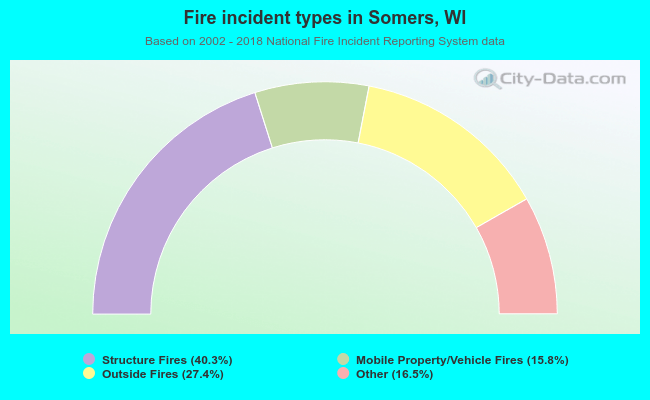 When looking into fire subcategories, the most incidents belonged to: Structure Fires (40.3%), and Outside Fires (27.4%).