Oak Creek: Fire Incidents, Wisconsin (WI)
Where are fire incidents reported in Oak Creek, WI
Something went wrong! Please refresh the page.
| Fire incidents reported | |
|---|---|
| Sreet name | Count |
| CHICAGO RD | 214 |
| HOWELL AVE | 150 |
| RYAN RD | 94 |
| 13TH ST | 88 |
| PENNSYLVANIA AVE | 88 |
| OAKWOOD RD | 72 |
| 27TH ST | 64 |
| RAWSON AVE | 60 |
| ELM RD | 56 |
| PUETZ RD | 56 |
| COLLEGE AVE | 54 |
| 10TH ST | 52 |
| WILDWOOD DR | 52 |
| 6TH ST | 38 |
| 20TH ST | 36 |
| 5TH AVE | 36 |
| DREXEL AVE | 36 |
| I-94 NORTHBOUND (WEST) | 34 |
| WOOD CREEK DR | 32 |
| CHICAGO AVE | 28 |
| I-94 SOUTHBOUND (EAST) | 28 |
| NICHOLSON RD | 28 |
| OAK PARK DR | 26 |
| I94 NORTHBOUNDWEST | 24 |
| FOREST HILL AVE | 22 |
| RIDGEVIEW DR | 22 |
| TIMBER RIDGE LN | 22 |
| I94 SOUTHBOUNDEAST | 20 |
| ADDISON LN | 18 |
| SHEPARD AVE | 18 |
2002 - 2018 National Fire Incident Reporting System (NFIRS) incidents
- Incident types reported to NFIRS in Oak Creek, WI
- 13,79873.0%Rescue & EMS
- 1,3227.0%Fire
- 1,2846.8%False Alarm
- 9134.8%Service Call
- 8114.3%Hazardous Condition
- 7023.7%Good Intent Call
- 320.2%Overpressure Rupture
- 280.1%Special Incident
- Fire incident types reported to NFIRS in Oak Creek, WI
- 71854.3%Structure Fires
- 36627.7%Outside Fires
- 20315.4%Mobile Property/Vehicle Fires
- 352.6%Other
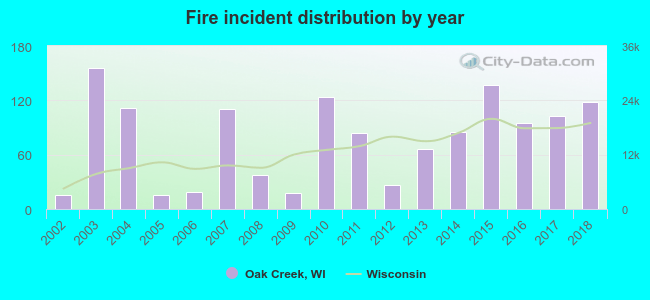 According to the data from the years 2002 - 2018 the average number of fire incidents per year is 78. The highest number of fires - 156 took place in 2003, and the least - 16 in 2002. The data has a growing trend.
The average number of yearly fire incidents per 10k residents in Oak Creek, WI compared to nearest cities:
(Note: Based on data for the last 3 years, including only cities with population 5,000 and above)
| Oak Creek: | 30.0 |
| South Milwaukee: | 23.5 |
| Cudahy: | 31.1 |
| Franklin: | 22.7 |
| Greendale: | 17.0 |
| Caledonia: | 8.1 |
| Greenfield: | 14.3 |
| Hales Corners: | 25.4 |
| West Allis: | 18.9 |
 The median response time based on all reported fire incidents is 6 minutes. This is similar to the Wisconsin median value.
The median response time in Oak Creek, WI compared to nearest cities:
(Note: Based on data for all years, including only cities with at least 500 fire incidents)
| Oak Creek: | 6 minutes |
| South Milwaukee: | 3 minutes |
| Cudahy: | 3 minutes |
| Franklin: | 6 minutes |
| Greenfield: | 6 minutes |
| West Allis: | 4 minutes |
| Muskego: | 7 minutes |
| Racine: | 5 minutes |
| Milwaukee: | 4 minutes |
 Based on the data from the years 2002 - 2018 the average number of fire-related casualties per year is 1. The highest number of reported injuries - 7 took place in 2010, and the lowest - 0 in 2002. The data has a rising trend.
The average number of casualties per 1,000 fires is 10. This indicator was the highest - 56 in 2010, and the lowest 0 in 2002. The trend for injuries per 1,000 fires is growing. Compared to the Wisconsin value the number of casualties per 1,000 incidents is higher.
Based on the data from the years 2002 - 2018 the average number of fire-related casualties per year is 1. The highest number of reported injuries - 7 took place in 2010, and the lowest - 0 in 2002. The data has a rising trend.
The average number of casualties per 1,000 fires is 10. This indicator was the highest - 56 in 2010, and the lowest 0 in 2002. The trend for injuries per 1,000 fires is growing. Compared to the Wisconsin value the number of casualties per 1,000 incidents is higher.Casualties per 1,000 incidents in Oak Creek, WI compared to nearest cities:
(Note: Based on data for all years, including only cities with at least 500 fire incidents)
| Oak Creek: | 15.1 |
| South Milwaukee: | 18.4 |
| Cudahy: | 8.5 |
| Franklin: | 11.6 |
| Greenfield: | 4.0 |
| West Allis: | 53.5 |
| Muskego: | 0.0 |
| Racine: | 13.2 |
| Milwaukee: | 1.6 |
 37.7% incidents where reported in the morning and 62.3% in the evening. The most fires (16.9%) took place on Saturday, and the least (12.7%) on Monday.
 According to the 1,322 fire incidents from years 2002 - 2018 most fires (11.2%) took place during July, and the least (6.1%) in February.
 Out of all 18,898 cases reported during the years 2002 - 2018, the most belonged to the categories: Rescue & EMS (73.0%), Fire (7.0%), and False Alarm (6.8%).
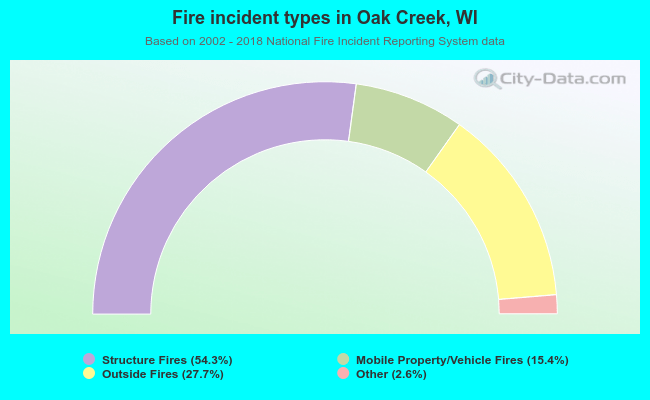 When looking into fire subcategories, the most reports belonged to: Structure Fires (54.3%), and Outside Fires (27.7%).