Souderton: Fire Incidents, Pennsylvania (PA)
Where are fire incidents reported in Souderton, PA
Something went wrong! Please refresh the page.
|
| |||||||||||||||||||||||||||||||||||||||||||||||||||||||||||||||||||||||||||||||||||||||||||||||||||||||||||||
2004 - 2018 National Fire Incident Reporting System (NFIRS) incidents
- Incident types reported to NFIRS in Souderton, PA
- 16727.6%Fire
- 15024.8%Hazardous Condition
- 9115.1%Rescue & EMS
- 9115.1%False Alarm
- 6110.1%Service Call
- 355.8%Good Intent Call
- 61.0%Special Incident
- 20.3%Severe Weather
- 10.2%Overpressure Rupture
- Fire incident types reported to NFIRS in Souderton, PA
- 11770.1%Structure Fires
- 2615.6%Outside Fires
- 127.2%Mobile Property/Vehicle Fires
- 127.2%Other
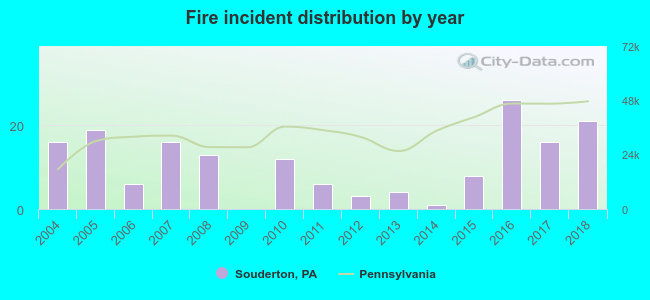 According to the data from the years 2004 - 2018 the average number of fire incidents per year is 11. The highest number of fires - 26 took place in 2016, and the least - 0 in 2009. The data has an increasing trend.
The average number of yearly fire incidents per 10k residents in Souderton, PA compared to nearest cities:
(Note: Based on data for the last 3 years, including only cities with population 5,000 and above)
| Souderton: | 31.2 |
| Harleysville: | 12.9 |
| Perkasie: | 85.3 |
| Lansdale: | 10.5 |
| Montgomeryville: | 26.9 |
| Quakertown: | 61.6 |
| Doylestown: | 143.7 |
| East Norriton: | 30.3 |
| Collegeville: | 88.9 |
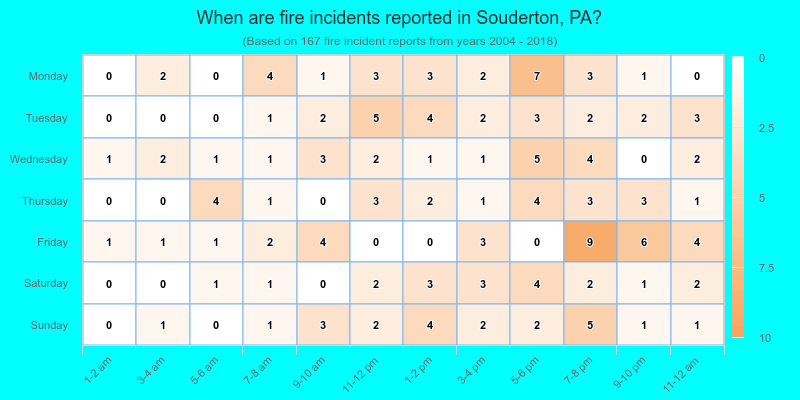
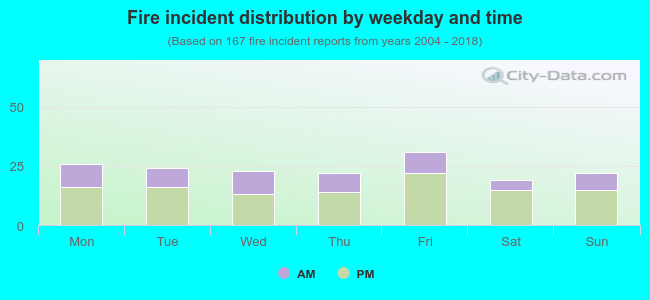 33.5% incidents where reported in the morning and 66.5% in the evening. The most fires (18.6%) took place on Friday, and the least (11.4%) on Saturday.
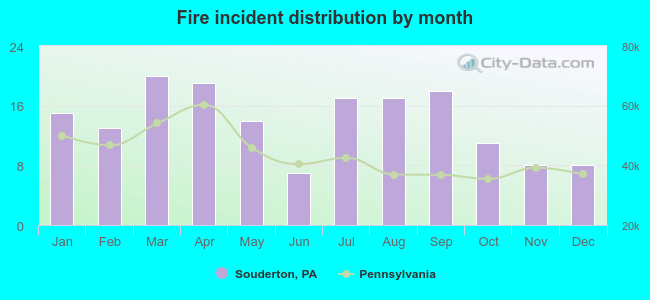 Based on the 167 reports from years 2004 - 2018 most fires (12.0%) took place during March, and the least (4.2%) in June.
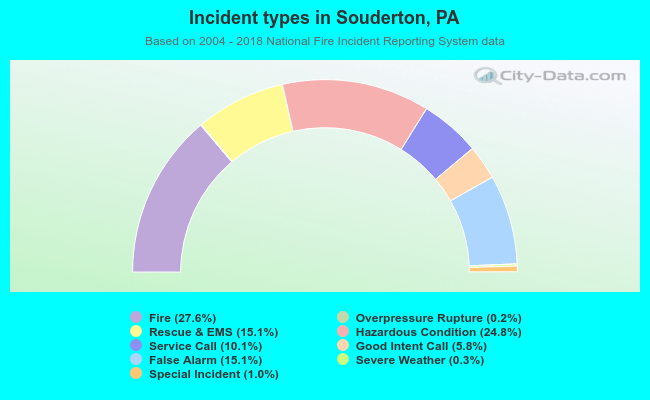 Out of all 604 cases reported during the years 2004 - 2018, the most belonged to the categories: Fire (27.6%), Hazardous Condition (24.8%), and Rescue & EMS (15.1%).
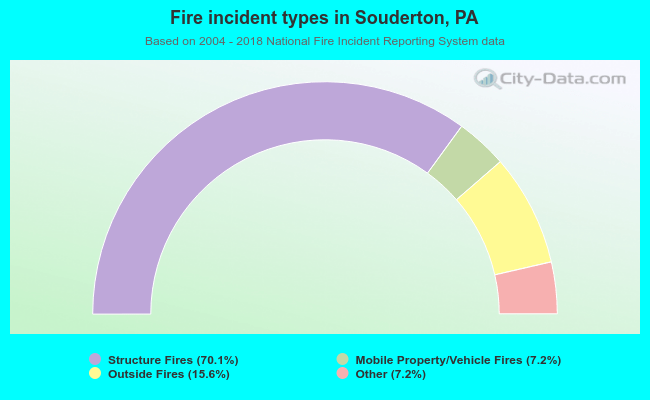 When looking into fire subcategories, the most incidents belonged to: Structure Fires (70.1%), and Outside Fires (15.6%).