Quakertown: Fire Incidents, Pennsylvania (PA)
Where are fire incidents reported in Quakertown, PA
Something went wrong! Please refresh the page.
|
| |||||||||||||||||||||||||||||||||||||||||||||||||||||||||||||||||||||||||||||||||||||||||||||||||||||||||||||
2003 - 2018 National Fire Incident Reporting System (NFIRS) incidents
- Incident types reported to NFIRS in Quakertown, PA
- 1,36135.6%Fire
- 99926.1%Hazardous Condition
- 88723.2%Rescue & EMS
- 2306.0%False Alarm
- 1734.5%Service Call
- 1373.6%Good Intent Call
- 190.5%Special Incident
- 90.2%Overpressure Rupture
- 60.2%Severe Weather
- Fire incident types reported to NFIRS in Quakertown, PA
- 88665.1%Structure Fires
- 33024.2%Outside Fires
- 1178.6%Mobile Property/Vehicle Fires
- 282.1%Other
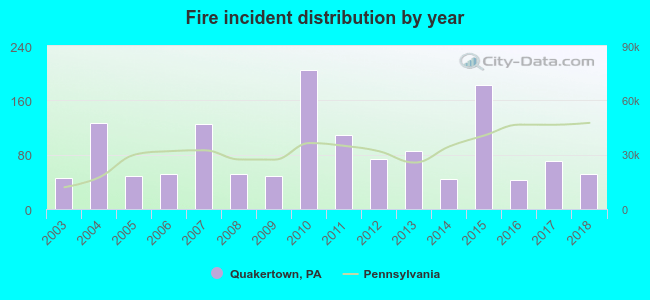 Based on the data from the years 2003 - 2018 the average number of fires per year is 85. The highest number of reported fire incidents - 205 took place in 2010, and the least - 43 in 2016. The data has a growing trend.
The average number of yearly fire incidents per 10k residents in Quakertown, PA compared to nearest cities:
(Note: Based on data for the last 3 years, including only cities with population 5,000 and above)
| Quakertown: | 61.6 |
| Perkasie: | 85.3 |
| Souderton: | 31.2 |
| Hellertown: | 22.2 |
| Emmaus: | 31.8 |
| Harleysville: | 12.9 |
| Bethlehem: | 29.6 |
| Allentown: | 11.6 |
| Lansdale: | 10.5 |
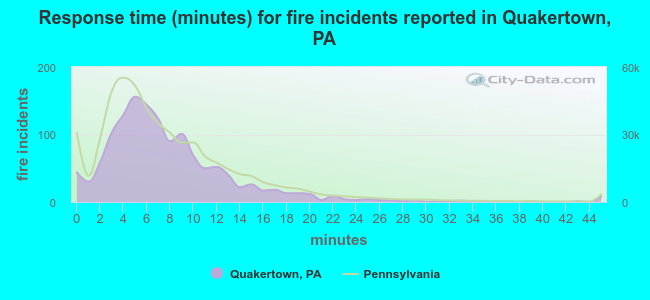 The median response time based on all reported fire incidents is 7 minutes. This is close to the state median value.
The median response time in Quakertown, PA compared to nearest cities:
(Note: Based on data for all years, including only cities with at least 500 fire incidents)
| Quakertown: | 7 minutes |
| Perkasie: | 6 minutes |
| Bethlehem: | 5 minutes |
| Allentown: | 6 minutes |
| Doylestown: | 6 minutes |
| Boyertown: | 7 minutes |
| Easton: | 4 minutes |
| Northampton: | 11 minutes |
| Phillipsburg: | 5 minutes |
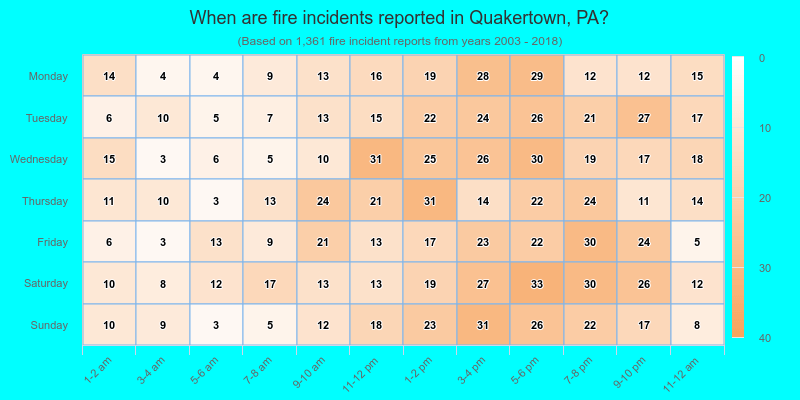
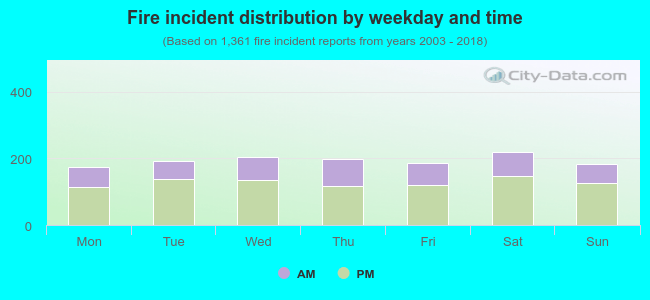 34.0% incidents where reported in the morning and 66.0% in the evening. The most fires (16.2%) took place on Saturday, and the least (12.9%) on Monday.
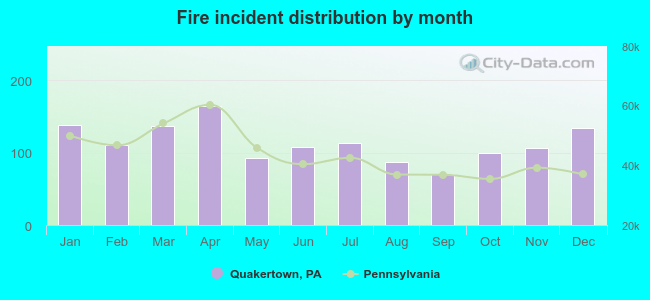 According to the 1,361 incident reports from years 2003 - 2018 most fires (12.1%) took place during April, and the least (5.2%) in September.
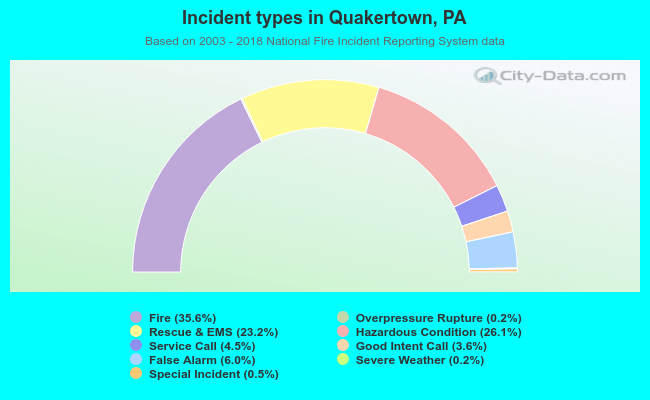 Out of all 3,821 cases reported during the years 2003 - 2018, the most belonged to the categories: Fire (35.6%), Hazardous Condition (26.1%), and Rescue & EMS (23.2%).
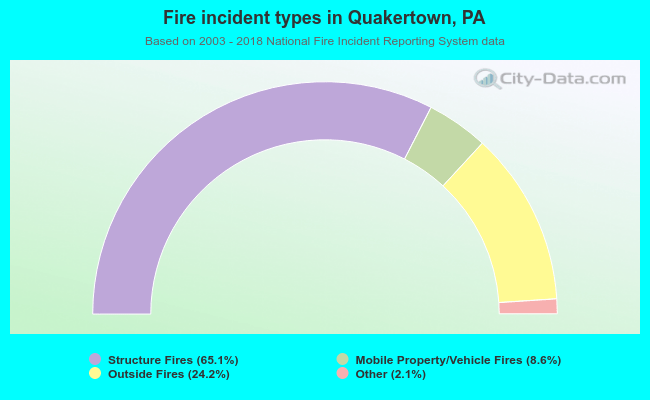 When looking into fire subcategories, the most reports belonged to: Structure Fires (65.1%), and Outside Fires (24.2%).