St. John: Fire Incidents, Indiana (IN)
Where are fire incidents reported in St. John, IN
Something went wrong! Please refresh the page.
|
| |||||||||||||||||||||||||||||||||||||||||||||||||||||||||||||||||||||||||||||||||||||||||||||||||||||||||||||
2003 - 2011 National Fire Incident Reporting System (NFIRS) incidents
- Incident types reported to NFIRS in St. John, IN
- 38351.5%Fire
- 15721.1%Rescue & EMS
- 11715.7%Hazardous Condition
- 334.4%Service Call
- 324.3%False Alarm
- 202.7%Good Intent Call
- 10.1%Severe Weather
- 10.1%Special Incident
- Fire incident types reported to NFIRS in St. John, IN
- 21856.9%Outside Fires
- 7720.1%Structure Fires
- 4411.5%Mobile Property/Vehicle Fires
- 4411.5%Other
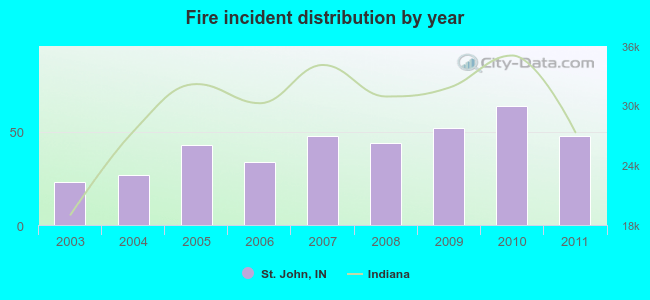 Based on the data from the years 2003 - 2011 the average number of fire incidents per year is 43. The highest number of fires - 64 took place in 2010, and the least - 23 in 2003. The data has a rising trend.
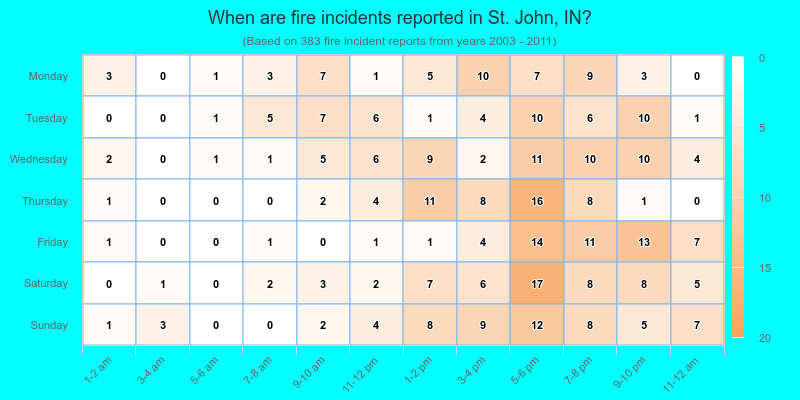
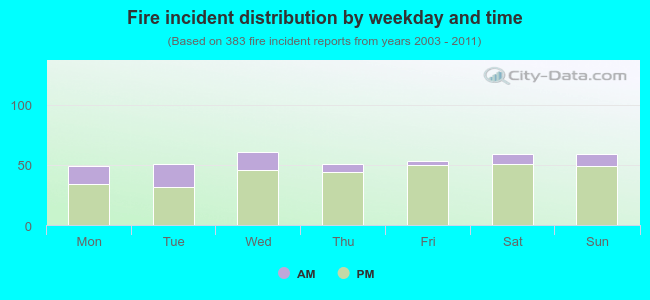 20.1% incidents where reported in the morning and 79.9% in the evening. The most fires (15.9%) took place on Wednesday, and the least (12.8%) on Monday.
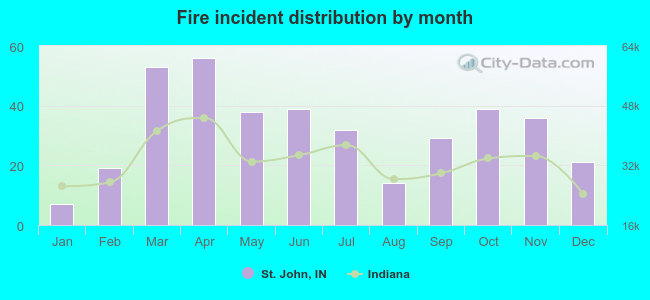 According to the 383 incident reports from years 2003 - 2011 most fires (14.6%) took place during April, and the least (1.8%) in January.
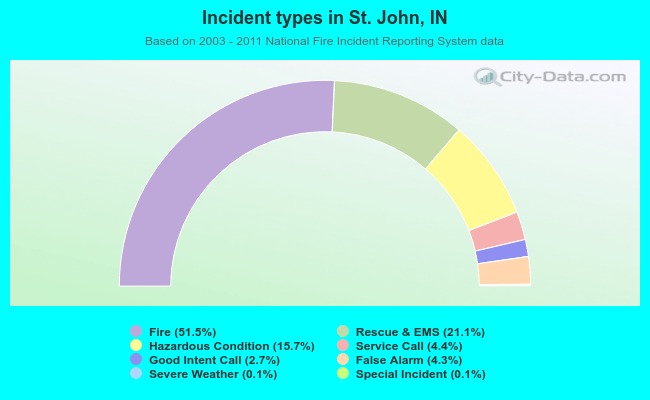 Out of all 744 cases reported during the years 2003 - 2011, the most belonged to the categories: Fire (51.5%), Overpressure Rupture (21.1%), and Rescue & EMS (15.7%).
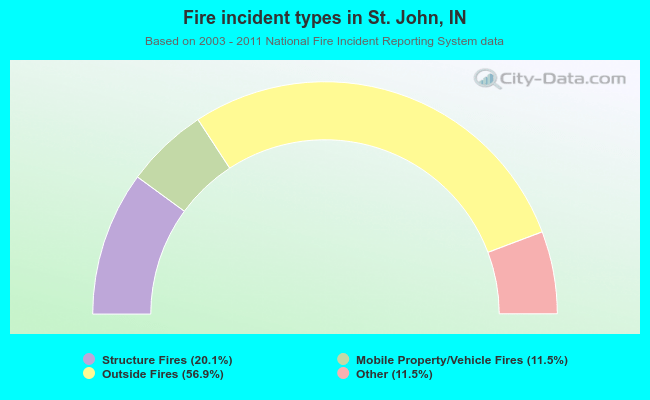 When looking into fire subcategories, the most incidents belonged to: Outside Fires (56.9%), and Structure Fires (20.1%).