St. John, Indiana


Submit your own pictures of this town and show them to the world
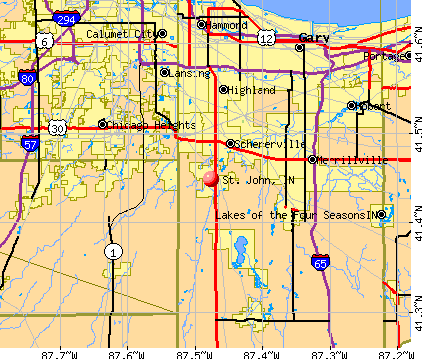
- OSM Map
- General Map
- Google Map
- MSN Map
Population change since 2000: +172.6%
| Males: 11,401 | |
| Females: 11,446 |
| Median resident age: | 42.1 years |
| Indiana median age: | 38.2 years |
Zip codes: 46373.
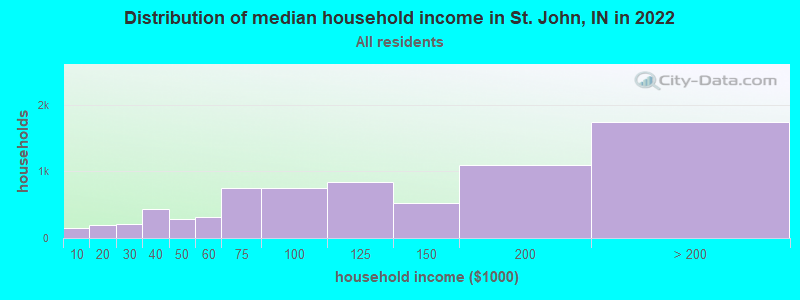
| St. John: | $123,258 |
| IN: | $66,785 |
Estimated per capita income in 2022: $50,905 (it was $25,106 in 2000)
St. John town income, earnings, and wages data
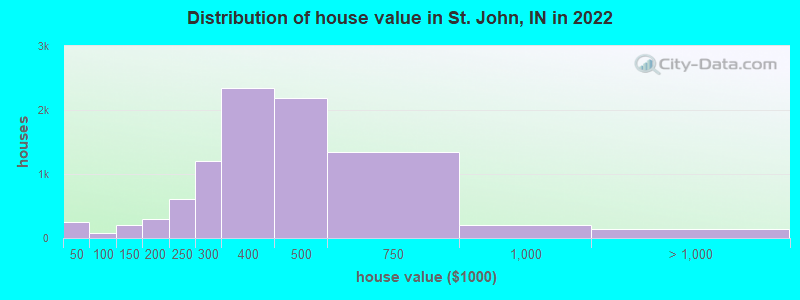
Estimated median house or condo value in 2022: $400,420 (it was $171,000 in 2000)
| St. John: | $400,420 |
| IN: | $208,700 |
Mean prices in 2022: all housing units: $442,675; detached houses: $461,952; townhouses or other attached units: $335,301; mobile homes: $32,831
Median gross rent in 2022: $909.
(2.3% for White Non-Hispanic residents, 0.5% for Hispanic or Latino residents, 1.6% for other race residents)
Detailed information about poverty and poor residents in St. John, IN

Compare current foreclosures near St. John, IN:
| Photo | Address | Area | Beds / Baths | Price | Details |
|---|---|---|---|---|---|

|
#1
Dorchester Ave
Dolton, IL 60419
|
925 sq. feet
|
1 baths 3 beds |
$86,100
|
show details |

|
#2
Richton Rd
Steger, IL 60475
|
1,400 sq. feet
|
1 baths 3 beds |
$209,900
|
show details |

|
#3
Lincoln Ave
Dolton, IL 60419
|
1,966 sq. feet
|
2 baths 3 beds |
$77,500
|
show details |

|
#4
186th St
Lansing, IL 60438
|
2,177 sq. feet
|
1 baths 4 beds |
$95,000
|
show details |

|
#5
Idlewild Dr
Country Club Hills, IL 60478
|
1,300 sq. feet
|
1 baths 3 beds |
$279,900
|
show details |

|
#6
Finch Ave
Harvey, IL 60426
|
1,108 sq. feet
|
2 baths 3 beds |
$225,000
|
show details |

|
#7
W Margaret St
Monee, IL 60449
|
1,680 sq. feet
|
2 baths 4 beds |
$287,000
|
show details |

|
#8
Ellsworth Pl
Gary, IN 46408
|
1,248 sq. feet
|
1 baths 2 beds |
$79,900
|
show details |

|
#9
Marquette Ave
Calumet City, IL 60409
|
1,316 sq. feet
|
1 baths 3 beds |
$144,000
|
show details |

|
#10
Greenwood Rd Apt B210
Dolton, IL 60419
|
900 sq. feet
|
1 baths 2 beds |
$89,000
|
show details |
| Photo | Address | Area | Beds / Baths | Price | Details |
|---|---|---|---|---|---|

|
#11
Tarpon Ct
Homewood, IL 60430
|
1,800 sq. feet
|
3 baths 4 beds |
$355,000
|
show details |

|
#12
Hellenic Dr
Olympia Fields, IL 60461
|
4,000 sq. feet
|
3 baths 4 beds |
$495,000
|
show details |

|
#13
S Normal Ave
Chicago, IL 60628
|
989 sq. feet
|
1 baths 3 beds |
$154,375
|
show details |

|
#14
John St
Whiting, IN 46394
|
1,320 sq. feet
|
2 baths 3 beds |
$169,900
|
show details |

|
#15
176th Pl
Lansing, IL 60438
|
1,511 sq. feet
|
1 baths 2 beds |
$187,200
|
show details |

|
#16
W 53rd Ln
Merrillville, IN 46410
|
1,194 sq. feet
|
1 baths 3 beds |
$235,000
|
show details |

|
#17
N Bruce Ln Apt 311
Glenwood, IL 60425
|
1,000 sq. feet
|
2 baths 2 beds |
$185,000
|
show details |

|
#18
Peoria St
Steger, IL 60475
|
616 sq. feet
|
1 baths 2 beds |
$85,000
|
show details |

|
#19
Prairie Ave
Calumet City, IL 60409
|
2,841 sq. feet
|
2 baths 6 beds |
$159,500
|
show details |

|
#20
S Iris Ct
Monee, IL 60449
|
- sq. feet
|
2 baths 4 beds |
$324,900
|
show details |
| Photo | Address | Area | Beds / Baths | Price | Details |
|---|---|---|---|---|---|

|
#21
S California Ave
Posen, IL 60469
|
1,326 sq. feet
|
2 baths 2 beds |
show details | |

|
#22
Kasten Dr
Dolton, IL 60419
|
1,121 sq. feet
|
1 baths - beds |
$69,900
|
show details |

|
#23
Jefferson St
Dolton, IL 60419
|
1,209 sq. feet
|
1 baths - beds |
$116,900
|
show details |

|
#24
Arkansas Ave
Hammond, IN 46323
|
2,762 sq. feet
|
2 baths 3 beds |
show details | |

|
#25
S Halsted St
Riverdale, IL 60827
|
1,040 sq. feet
|
3 baths 4 beds |
show details | |

|
#26
Fairfield Ave
Olympia Fields, IL 60461
|
1,724 sq. feet
|
2 baths 4 beds |
show details | |

|
#27
W 72nd Ave
Merrillville, IN 46410
|
1,684 sq. feet
|
1 baths 3 beds |
show details | |

|
#28
Fillmore St
Gary, IN 46402
|
1,635 sq. feet
|
1 baths 3 beds |
show details | |

|
#29
S Ashland Ave
Crete, IL 60417
|
2,636 sq. feet
|
3 baths 3 beds |
show details | |

|
#30
Noble Ave
Hammond, IN 46320
|
1,102 sq. feet
|
1 baths 3 beds |
show details |
| Photo | Address | Area | Beds / Baths | Price | Details |
|---|---|---|---|---|---|

|
#31
E 194th St
Glenwood, IL 60425
|
1,405 sq. feet
|
2 baths 3 beds |
show details | |

|
#32
University Ave
South Holland, IL 60473
|
1,659 sq. feet
|
1 baths 3 beds |
show details | |

|
#33
Fairfield Ave
Olympia Fields, IL 60461
|
- sq. feet
|
2 baths 4 beds |
show details | |

|
#34
Burnham Ave
Lansing, IL 60438
|
1,056 sq. feet
|
1 baths 3 beds |
show details | |

|
#35
Michigan Ave
South Holland, IL 60473
|
1,662 sq. feet
|
2 baths 4 beds |
show details | |

|
#36
Jefferson Pl
Gary, IN 46408
|
1,210 sq. feet
|
1 baths 3 beds |
show details | |

|
#37
S Manistee Ave
Chicago, IL 60633
|
1,350 sq. feet
|
1 baths 3 beds |
show details | |

|
#38
219th St
Chicago Heights, IL 60411
|
1,173 sq. feet
|
2 baths 3 beds |
show details | |

|
#39
Lakeshore Dr
Richton Park, IL 60471
|
1,436 sq. feet
|
2 baths 3 beds |
show details | |

|
#40
E Richton Rd
Crete, IL 60417
|
3,050 sq. feet
|
3 baths 4 beds |
show details |
| Photo | Address | Area | Beds / Baths | Price | Details |
|---|---|---|---|---|---|

|
#41
S Rhodes Ave
Riverdale, IL 60827
|
753 sq. feet
|
1 baths 2 beds |
show details | |

|
#42
Chase St
Gary, IN 46404
|
2,604 sq. feet
|
2 baths 3 beds |
show details | |

|
#43
Yates Ave
Chicago Heights, IL 60411
|
988 sq. feet
|
1 baths 3 beds |
show details | |

|
#44
Elm Ct
Flossmoor, IL 60422
|
1,471 sq. feet
|
2 baths 4 beds |
show details | |

|
#45
Parrish Ave
East Chicago, IN 46312
|
840 sq. feet
|
1 baths 2 beds |
show details | |

|
#46
Cooper Ave
Harvey, IL 60426
|
720 sq. feet
|
1 baths 3 beds |
show details | |

|
#47
Charlemagne Ave
Hazel Crest, IL 60429
|
1,022 sq. feet
|
1 baths 3 beds |
show details | |

|
#48
Glen Dr
Merrillville, IN 46410
|
1,499 sq. feet
|
2 baths 4 beds |
show details | |

|
#49
Lexington Dr
Hazel Crest, IL 60429
|
1,201 sq. feet
|
1 baths 3 beds |
show details | |

|
Check over 1 million property listings on Foreclosure.com!
|
browse all offers | |||


- 16,01977.0%White alone
- 2,68012.9%Hispanic
- 9894.8%Other race alone
- 5812.8%Black alone
- 3741.8%Two or more races
- 3601.7%Asian alone
- 250.1%American Indian alone
- 220.1%Native Hawaiian and Other
Pacific Islander alone
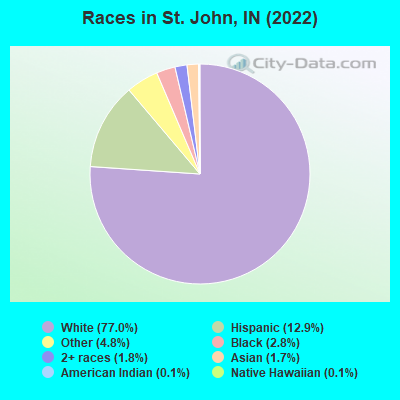
Races in St. John detailed stats: ancestries, foreign born residents, place of birth
According to our research of Indiana and other state lists, there was 1 registered sex offender living in St. John, Indiana as of April 29, 2024.
The ratio of all residents to sex offenders in St. John is 15,652 to 1.
The ratio of registered sex offenders to all residents in this city is much lower than the state average.
Type |
2009 |
2010 |
2011 |
2012 |
2013 |
2014 |
2015 |
2016 |
2017 |
2018 |
2019 |
2020 |
2021 |
2022 |
|---|---|---|---|---|---|---|---|---|---|---|---|---|---|---|
| Murders (per 100,000) | 0 (0.0) | 0 (0.0) | 0 (0.0) | 0 (0.0) | 0 (0.0) | 0 (0.0) | 1 (6.1) | 0 (0.0) | 0 (0.0) | 0 (0.0) | 0 (0.0) | 0 (0.0) | 0 (0.0) | 0 (0.0) |
| Rapes (per 100,000) | 1 (7.3) | 0 (0.0) | 0 (0.0) | 1 (6.7) | 0 (0.0) | 0 (0.0) | 0 (0.0) | 2 (11.9) | 0 (0.0) | 1 (5.7) | 1 (5.4) | 1 (5.2) | 0 (0.0) | 0 (0.0) |
| Robberies (per 100,000) | 1 (7.3) | 1 (6.7) | 1 (6.7) | 1 (6.7) | 0 (0.0) | 0 (0.0) | 1 (6.1) | 1 (5.9) | 1 (5.8) | 0 (0.0) | 3 (16.2) | 0 (0.0) | 1 (5.0) | 0 (0.0) |
| Assaults (per 100,000) | 0 (0.0) | 0 (0.0) | 13 (87.1) | 6 (40.3) | 3 (19.4) | 5 (31.5) | 1 (6.1) | 1 (5.9) | 1 (5.8) | 2 (11.4) | 0 (0.0) | 3 (15.6) | 0 (0.0) | 1 (4.4) |
| Burglaries (per 100,000) | 16 (117.5) | 10 (67.3) | 24 (160.8) | 18 (120.9) | 17 (109.9) | 26 (163.8) | 8 (48.7) | 20 (118.9) | 21 (122.6) | 15 (85.2) | 11 (59.5) | 5 (25.9) | 2 (9.9) | 7 (31.1) |
| Thefts (per 100,000) | 125 (918.0) | 156 (1,051) | 140 (938.0) | 116 (779.3) | 119 (769.1) | 72 (453.7) | 78 (474.7) | 101 (600.4) | 109 (636.4) | 89 (505.3) | 105 (568.2) | 65 (337.0) | 35 (173.5) | 50 (222.3) |
| Auto thefts (per 100,000) | 12 (88.1) | 5 (33.7) | 9 (60.3) | 5 (33.6) | 3 (19.4) | 3 (18.9) | 1 (6.1) | 3 (17.8) | 13 (75.9) | 7 (39.7) | 8 (43.3) | 9 (46.7) | 3 (14.9) | 0 (0.0) |
| Arson (per 100,000) | 0 (0.0) | 0 (0.0) | 0 (0.0) | 0 (0.0) | 0 (0.0) | 0 (0.0) | 0 (0.0) | 0 (0.0) | 0 (0.0) | 0 (0.0) | 0 (0.0) | 1 (5.2) | 0 (0.0) | 1 (4.4) |
| City-Data.com crime index | 60.1 | 51.4 | 73.0 | 57.8 | 43.9 | 37.4 | 38.1 | 46.2 | 43.0 | 36.2 | 39.6 | 26.3 | 10.3 | 12.0 |
The City-Data.com crime index weighs serious crimes and violent crimes more heavily. Higher means more crime, U.S. average is 246.1. It adjusts for the number of visitors and daily workers commuting into cities.
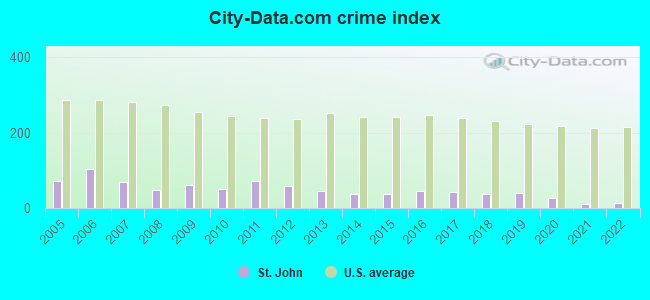
Crime rate in St. John detailed stats: murders, rapes, robberies, assaults, burglaries, thefts, arson
Full-time law enforcement employees in 2021, including police officers: 25 (23 officers - 22 male; 1 female).
| Officers per 1,000 residents here: | 1.14 |
| Indiana average: | 2.16 |
 Recent articles from our blog. Our writers, many of them Ph.D. graduates or candidates, create easy-to-read articles on a wide variety of topics.

 | St. John New Upscale Development: The Continental (23 replies) |
| St. John Police/Keeping the town safe (15 replies) |
| Schererville/St. John - neighborhoods (5 replies) |
| st. John (54 replies) |
| Why Isn’t Cedar Lake More Developed? (4 replies) |
| Shops 96 - St. John Commercial Development (0 replies) |
Latest news from St. John, IN collected exclusively by city-data.com from local newspapers, TV, and radio stations
Ancestries: Polish (18.9%), German (9.4%), Dutch (8.9%), Italian (7.7%), Irish (6.7%), English (5.6%).
Current Local Time: CST time zone
Elevation: 750 feet
Land area: 6.72 square miles.
Population density: 3,398 people per square mile (average).
1,282 residents are foreign born (2.4% Europe, 1.5% Asia, 1.5% Latin America).
| This town: | 6.2% |
| Indiana: | 5.6% |
Median real estate property taxes paid for housing units with mortgages in 2022: $3,682 (0.9%)
Median real estate property taxes paid for housing units with no mortgage in 2022: $3,392 (0.9%)
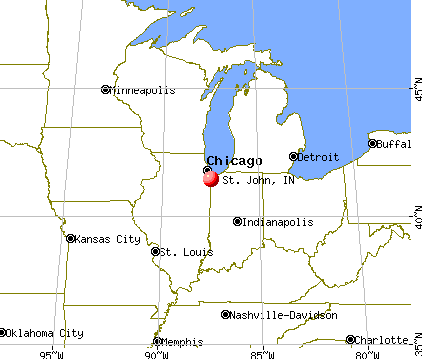
Nearest city with pop. 50,000+: Hammond, IN  (11.3 miles , pop. 83,048).
Nearest city with pop. 200,000+: Chicago, IL (29.1 miles , pop. 2,896,016).
Nearest cities:
Latitude: 41.45 N, Longitude: 87.48 W
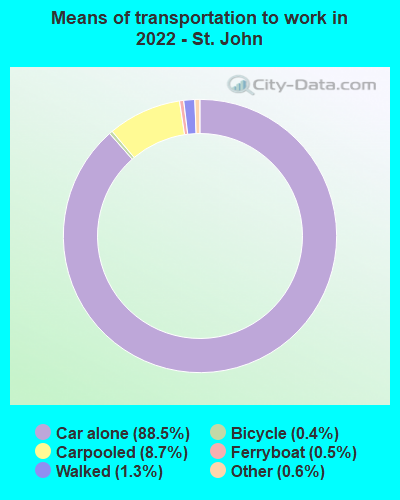
Daytime population change due to commuting: -3,984 (-19.1%)
Workers who live and work in this town: 2,361 (22.8%)
Area code commonly used in this area: 219

St. John, Indiana accommodation & food services, waste management - Economy and Business Data
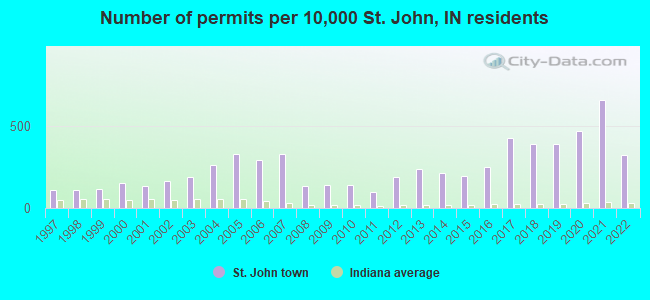
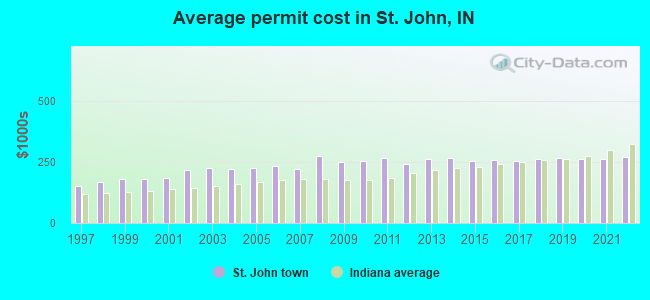
Single-family new house construction building permits:
- 2022: 268 buildings, average cost: $271,000
- 2021: 550 buildings, average cost: $264,000
- 2020: 394 buildings, average cost: $263,400
- 2019: 324 buildings, average cost: $266,400
- 2018: 326 buildings, average cost: $264,100
- 2017: 357 buildings, average cost: $254,300
- 2016: 210 buildings, average cost: $257,100
- 2015: 162 buildings, average cost: $254,600
- 2014: 178 buildings, average cost: $265,700
- 2013: 198 buildings, average cost: $261,600
- 2012: 160 buildings, average cost: $243,300
- 2011: 83 buildings, average cost: $268,300
- 2010: 116 buildings, average cost: $253,400
- 2009: 115 buildings, average cost: $252,000
- 2008: 112 buildings, average cost: $274,700
- 2007: 274 buildings, average cost: $220,000
- 2006: 242 buildings, average cost: $236,300
- 2005: 276 buildings, average cost: $226,600
- 2004: 221 buildings, average cost: $220,900
- 2003: 158 buildings, average cost: $223,800
- 2002: 137 buildings, average cost: $218,000
- 2001: 111 buildings, average cost: $185,900
- 2000: 129 buildings, average cost: $182,200
- 1999: 95 buildings, average cost: $181,200
- 1998: 92 buildings, average cost: $170,000
- 1997: 93 buildings, average cost: $151,900
| Here: | 4.7% |
| Indiana: | 2.8% |
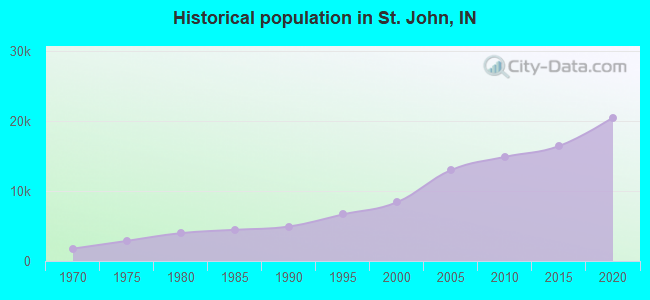
Population change in the 1990s: +3,377 (+67.5%).
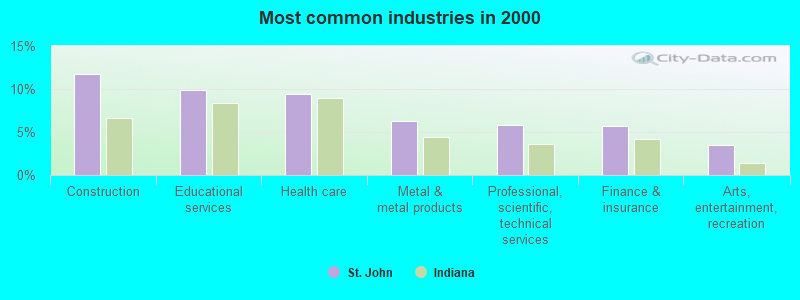
- Construction (11.7%)
- Educational services (9.9%)
- Health care (9.4%)
- Metal & metal products (6.3%)
- Professional, scientific, technical services (5.8%)
- Finance & insurance (5.7%)
- Arts, entertainment, recreation (3.5%)
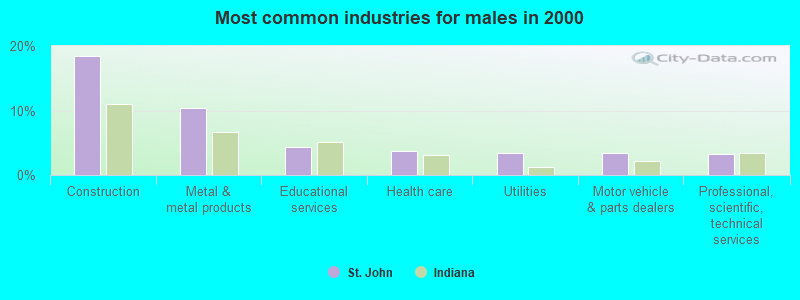
- Construction (18.5%)
- Metal & metal products (10.4%)
- Educational services (4.4%)
- Health care (3.6%)
- Utilities (3.5%)
- Motor vehicle & parts dealers (3.5%)
- Professional, scientific, technical services (3.3%)
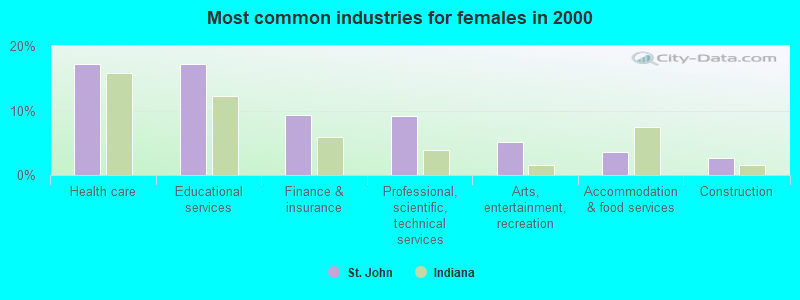
- Health care (17.2%)
- Educational services (17.2%)
- Finance & insurance (9.4%)
- Professional, scientific, technical services (9.1%)
- Arts, entertainment, recreation (5.1%)
- Accommodation & food services (3.5%)
- Construction (2.6%)
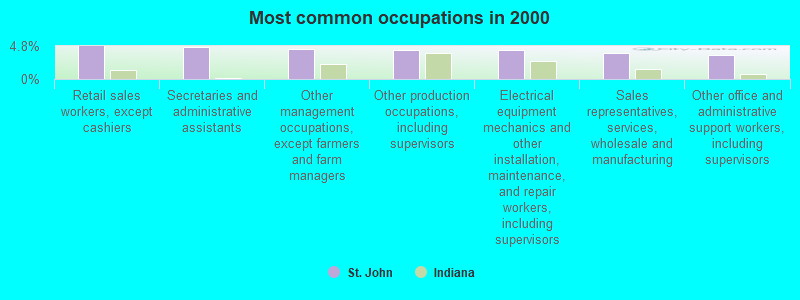
- Retail sales workers, except cashiers (4.8%)
- Secretaries and administrative assistants (4.7%)
- Other management occupations, except farmers and farm managers (4.3%)
- Other production occupations, including supervisors (4.2%)
- Electrical equipment mechanics and other installation, maintenance, and repair workers, including supervisors (4.2%)
- Sales representatives, services, wholesale and manufacturing (3.8%)
- Other office and administrative support workers, including supervisors (3.4%)
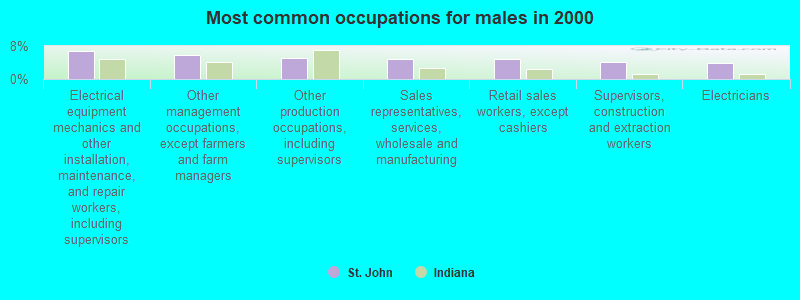
- Electrical equipment mechanics and other installation, maintenance, and repair workers, including supervisors (6.9%)
- Other management occupations, except farmers and farm managers (5.8%)
- Other production occupations, including supervisors (5.0%)
- Sales representatives, services, wholesale and manufacturing (4.9%)
- Retail sales workers, except cashiers (4.7%)
- Supervisors, construction and extraction workers (4.2%)
- Electricians (3.8%)

- Secretaries and administrative assistants (11.1%)
- Other office and administrative support workers, including supervisors (6.7%)
- Preschool, kindergarten, elementary, and middle school teachers (5.8%)
- Registered nurses (5.5%)
- Retail sales workers, except cashiers (5.0%)
- Other teachers, instructors, education, training, and library occupations (4.3%)
- Financial clerks, except bookkeeping, accounting and auditing clerks (4.3%)
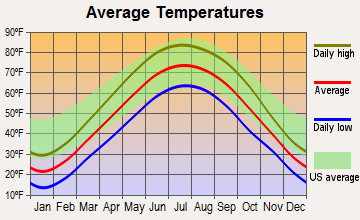
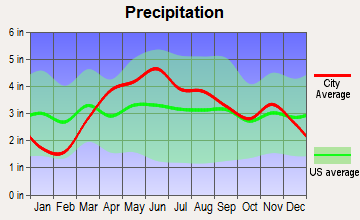
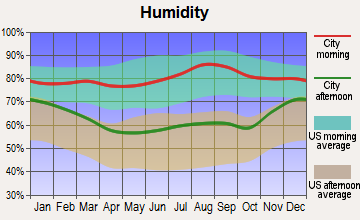
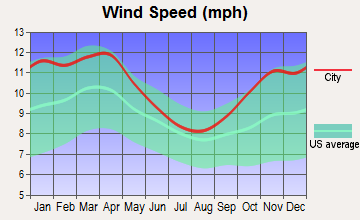
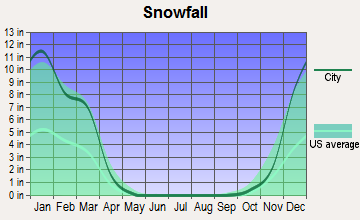
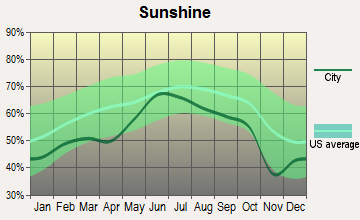
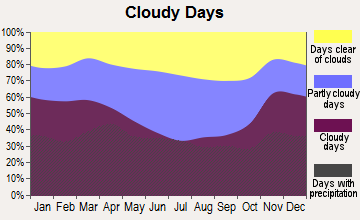
Average climate in St. John, Indiana
Based on data reported by over 4,000 weather stations
|
|


(lower is better)
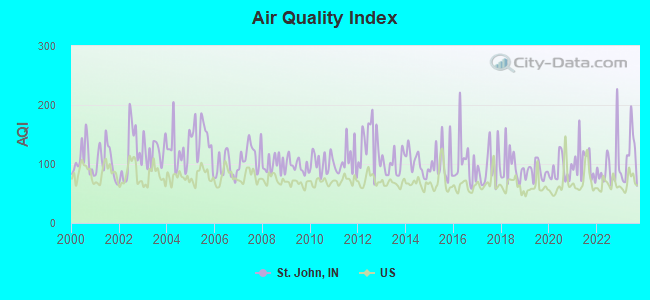
Air Quality Index (AQI) level in 2023 was 110. This is significantly worse than average.
| City: | 110 |
| U.S.: | 73 |
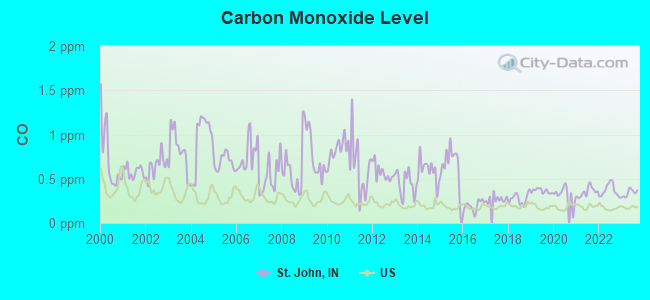
Carbon Monoxide (CO) [ppm] level in 2023 was 0.339. This is worse than average. Closest monitor was 9.9 miles away from the city center.
| City: | 0.339 |
| U.S.: | 0.251 |
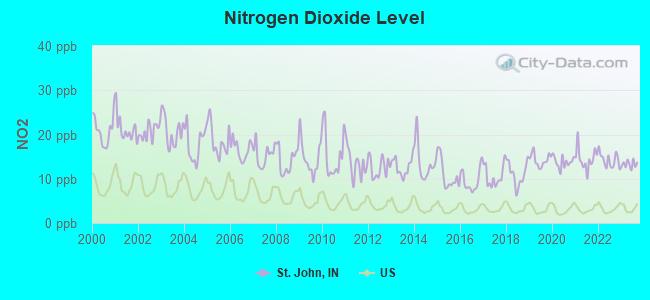
Nitrogen Dioxide (NO2) [ppb] level in 2023 was 13.3. This is significantly worse than average. Closest monitor was 7.5 miles away from the city center.
| City: | 13.3 |
| U.S.: | 5.1 |
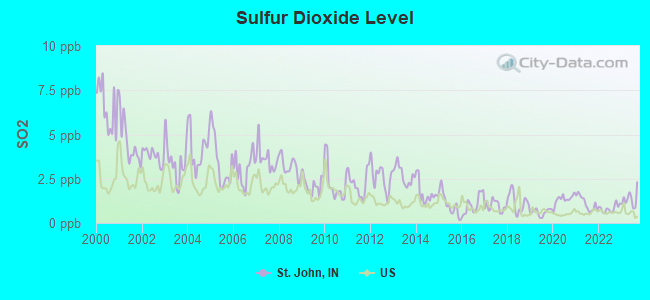
Sulfur Dioxide (SO2) [ppb] level in 2023 was 1.35. This is about average. Closest monitor was 7.5 miles away from the city center.
| City: | 1.35 |
| U.S.: | 1.51 |
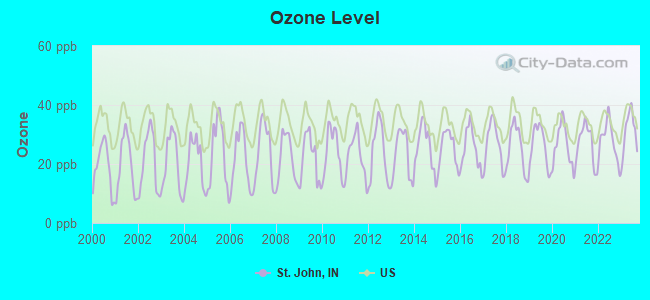
Ozone [ppb] level in 2023 was 31.1. This is about average. Closest monitor was 9.9 miles away from the city center.
| City: | 31.1 |
| U.S.: | 33.3 |
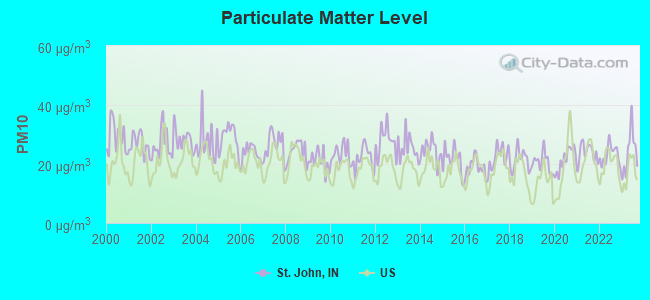
Particulate Matter (PM10) [µg/m3] level in 2023 was 24.0. This is worse than average. Closest monitor was 9.6 miles away from the city center.
| City: | 24.0 |
| U.S.: | 19.2 |
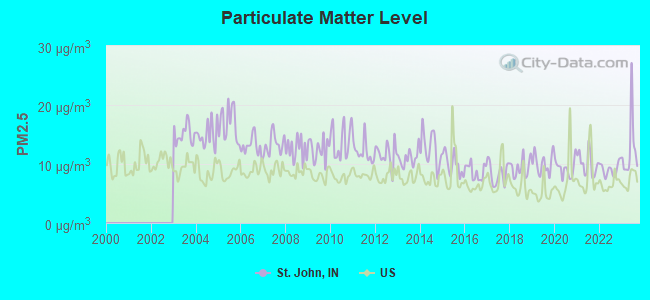
Particulate Matter (PM2.5) [µg/m3] level in 2023 was 12.4. This is significantly worse than average. Closest monitor was 7.3 miles away from the city center.
| City: | 12.4 |
| U.S.: | 8.1 |
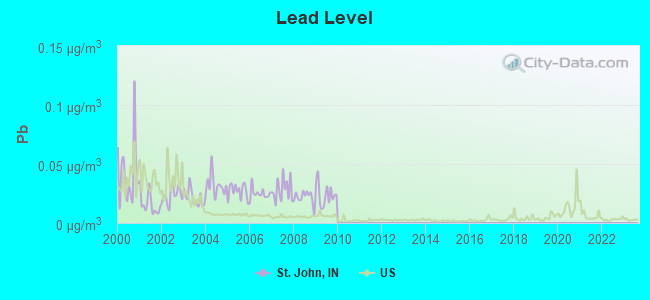
Lead (Pb) [µg/m3] level in 2009 was 0.0241. This is significantly worse than average. Closest monitor was 7.8 miles away from the city center.
| City: | 0.0241 |
| U.S.: | 0.0093 |
Tornado activity:
St. John-area historical tornado activity is slightly below Indiana state average. It is 65% greater than the overall U.S. average.
On 8/28/1990, a category F5 (max. wind speeds 261-318 mph) tornado 32.7 miles away from the St. John town center killed 29 people and injured 350 people and caused between $50,000 and $500,000 in damages.
On 4/21/1967, a category F4 (max. wind speeds 207-260 mph) tornado 19.9 miles away from the town center killed 33 people and injured 500 people and caused between $5,000,000 and $50,000,000 in damages.
Earthquake activity:
St. John-area historical earthquake activity is significantly above Indiana state average. It is 43% greater than the overall U.S. average.On 4/18/2008 at 09:36:59, a magnitude 5.4 (5.1 MB, 4.8 MS, 5.4 MW, 5.2 MW, Class: Moderate, Intensity: VI - VII) earthquake occurred 208.4 miles away from St. John center
On 6/10/1987 at 23:48:54, a magnitude 5.1 (4.9 MB, 4.4 MS, 4.6 MS, 5.1 LG) earthquake occurred 183.0 miles away from the city center
On 4/18/2008 at 09:36:59, a magnitude 5.2 (5.2 MW, Depth: 8.9 mi) earthquake occurred 208.4 miles away from the city center
On 6/28/2004 at 06:10:52, a magnitude 4.2 (4.2 MW, Depth: 6.2 mi, Class: Light, Intensity: IV - V) earthquake occurred 73.8 miles away from St. John center
On 6/18/2002 at 17:37:15, a magnitude 5.0 (4.3 MB, 4.6 MW, 5.0 LG) earthquake occurred 239.9 miles away from the city center
On 4/18/2008 at 15:14:16, a magnitude 4.8 (4.5 MB, 4.8 MW, 4.6 MW) earthquake occurred 206.5 miles away from St. John center
Magnitude types: regional Lg-wave magnitude (LG), body-wave magnitude (MB), surface-wave magnitude (MS), moment magnitude (MW)
Natural disasters:
The number of natural disasters in Lake County (19) is greater than the US average (15).Major Disasters (Presidential) Declared: 12
Emergencies Declared: 5
Causes of natural disasters: Floods: 11, Storms: 10, Winter Storms: 5, Tornadoes: 3, Snowstorms: 2, Hurricane: 1, Snow: 1, Other: 1 (Note: some incidents may be assigned to more than one category).
Hospitals and medical centers near St. John:
- TRADEWINDS REHAB CENTER INC (Hospital, about 1 miles away; ST JOHN, IN)
- TRADEWINDS REHAB CENTER INC (Hospital, about 1 miles away; ST JOHN, IN)
- DAVITA - ST. JOHN DIALYSIS (Dialysis Facility, about 2 miles away; ST JOHN, IN)
- PROVIDENCE AT HOME INC (Home Health Center, about 2 miles away; SAINT JOHN, IN)
- ASSURED HOME HEALTHCARE INC (Home Health Center, about 3 miles away; SCHERERVILLE, IN)
- AMERICAN HOME HEALTH SERVICES INC (Home Health Center, about 4 miles away; DYER, IN)
- KINDRED TRANSITIONAL CARE AND REHABILITATION-DYER (Nursing Home, about 4 miles away; DYER, IN)
Amtrak stations near St. John:
- 5 miles: DYER (SHEFFIELD RD.) . Services: enclosed waiting area, public payphones, free short-term parking, free long-term parking.
- 13 miles: HOMEWOOD (181 1ST ST. & PARK AVE.) . Services: ticket office, enclosed waiting area, public restrooms, public payphones, paid short-term parking, paid long-term parking, public transit connection.
- 18 miles: HAMMOND-WHITING (HAMMOND, 1135 CALUMET AVE.) . Services: ticket office, partially wheelchair accessible, enclosed waiting area, public restrooms, public payphones, free short-term parking, free long-term parking, call for taxi service.
Colleges/universities with over 2000 students nearest to St. John:
- Purdue University-Calumet Campus (about 10 miles; Hammond, IN; Full-time enrollment: 7,343)
- Prairie State College (about 10 miles; Chicago Heights, IL; FT enrollment: 4,050)
- Indiana University-Northwest (about 11 miles; Gary, IN; FT enrollment: 4,390)
- Governors State University (about 13 miles; University Park, IL; FT enrollment: 4,043)
- South Suburban College (about 14 miles; South Holland, IL; FT enrollment: 3,972)
- City Colleges of Chicago-Olive-Harvey College (about 20 miles; Chicago, IL; FT enrollment: 4,110)
- Chicago State University (about 20 miles; Chicago, IL; FT enrollment: 4,352)
Public high school in St. John:
- LAKE CENTRAL HIGH SCHOOL (Students: 2,978, Location: 8400 WICKER AVE, Grades: 9-12)
Public elementary/middle schools in St. John:
- KOLLING ELEMENTARY SCHOOL (Students: 809, Location: 8801 WICKER AVE, Grades: PK-4)
- HAL E CLARK MIDDLE SCHOOL (Location: 8915 W 93RD AVE, Grades: 5-8)
Private elementary/middle schools in St. John:
- CROWN POINT CHRISTIAN SCHOOL (Students: 528, Location: 10550 PARK PL, Grades: PK-8)
- ST JOHN EVANGELIST ELEMENTARY SCHOOL (Students: 370, Location: 9400 WICKER AVE, Grades: PK-8)
Points of interest:
Notable location: Saint John Fire Department (A). Display/hide its location on the map
Church in St. John: Saint John the Evangelist Catholic Church (A). Display/hide its location on the map
Cemeteries: Saint John Cemetery (1), Hack Cemetery (2). Display/hide their locations on the map
Lake: Bingo Lake (A). Display/hide its location on the map
Streams, rivers, and creeks: Bull Run (A). Display/hide its location on the map
Parks in St. John include: Prairie West Park (1), Lancer Park (2), Civic Memorial Park (3), James E Larimer Park (4), Timber Lane Park (5), Homestead Acres Park Number 1 (6), Homestead Acres Park Number 2 (7). Display/hide their locations on the map
Birthplace of: Jared Tomich - Football player.
Drinking water stations with addresses in St. John and their reported violations in the past:
PALMIRA GOLF & COUNTRY CLUB (Population served: 129, Groundwater):Past monitoring violations:
- 8 routine major monitoring violations
- 2 regular monitoring violations
| This town: | 2.9 people |
| Indiana: | 2.5 people |
| This town: | 83.7% |
| Whole state: | 66.9% |
| This town: | 3.2% |
| Whole state: | 6.9% |
Likely homosexual households (counted as self-reported same-sex unmarried-partner households)
- Lesbian couples: 0.4% of all households
- Gay men: 0.2% of all households
8 people in homes for the mentally retarded in 2000
Banks with branches in St. John (2011 data):
- JPMorgan Chase Bank, National Association: St. John Branch at 9600 Wicker Ave, branch established on 1967/02/15. Info updated 2011/11/10: Bank assets: $1,811,678.0 mil, Deposits: $1,190,738.0 mil, headquarters in Columbus, OH, positive income, International Specialization, 5577 total offices, Holding Company: Jpmorgan Chase & Co.
- BMO Harris Bank National Association: St. John Branch at 9770 Wicker Avenue, branch established on 1979/07/25. Info updated 2011/07/14: Bank assets: $97,264.0 mil, Deposits: $75,624.6 mil, headquarters in Chicago, IL, positive income, 717 total offices, Holding Company: Bank Of Montreal
For population 15 years and over in St. John:
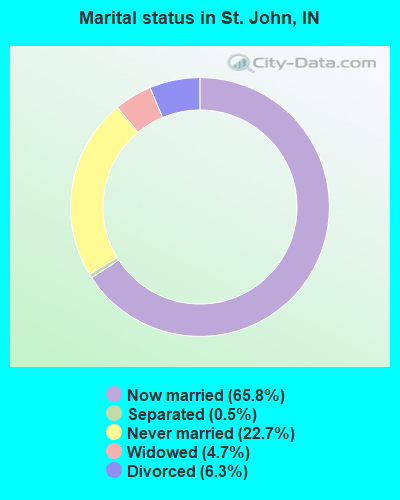
- Never married: 22.7%
- Now married: 65.8%
- Separated: 0.5%
- Widowed: 4.7%
- Divorced: 6.3%
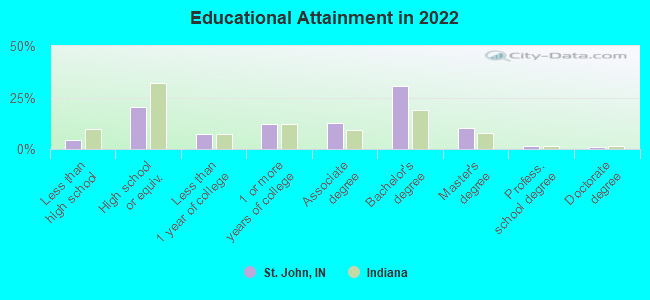
For population 25 years and over in St. John:
- High school or higher: 94.8%
- Bachelor's degree or higher: 40.0%
- Graduate or professional degree: 12.8%
- Unemployed: 2.5%
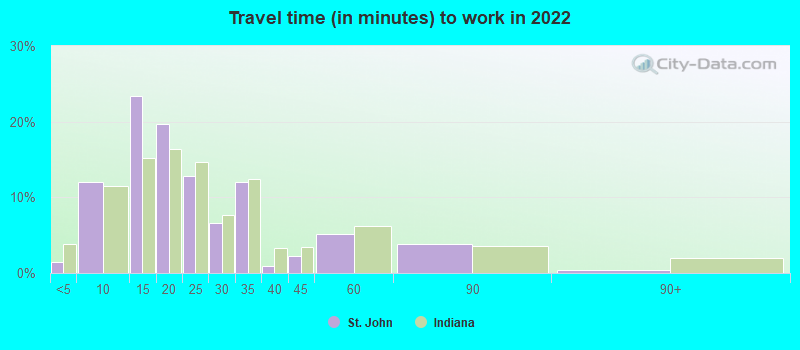
- Mean travel time to work (commute): 27.4 minutes
| Here: | 9.5 |
| Indiana average: | 11.3 |
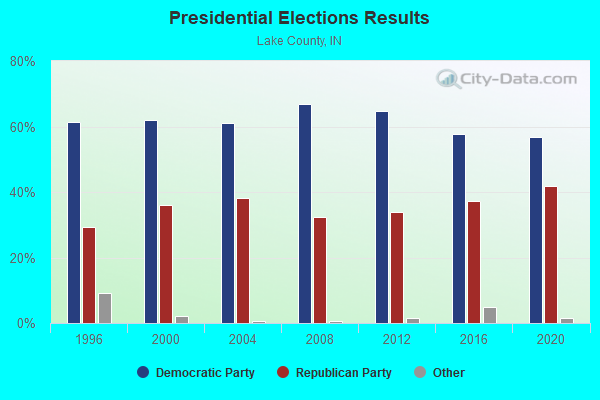
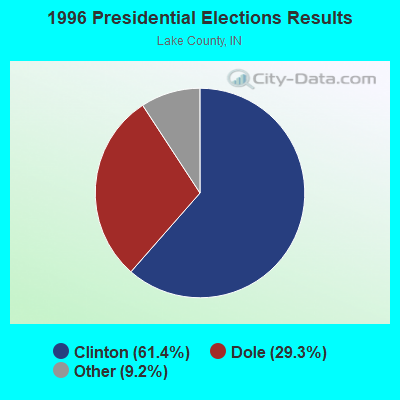
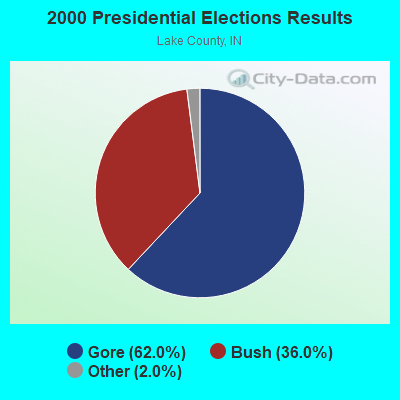
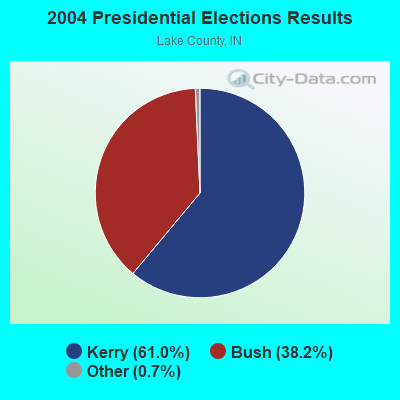
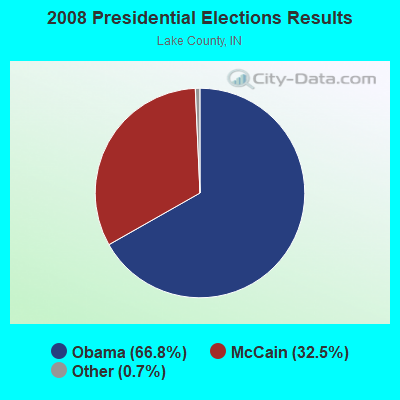
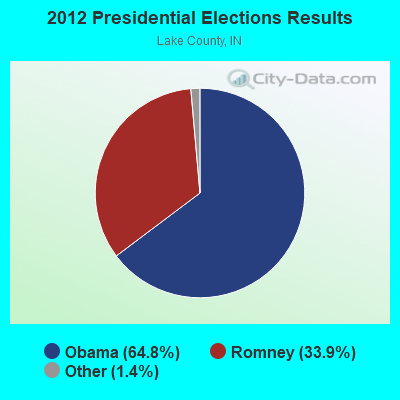

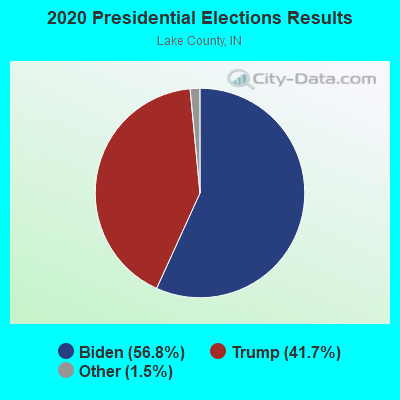
Graphs represent county-level data. Detailed 2008 Election Results
Religion statistics for St. John, IN (based on Lake County data)
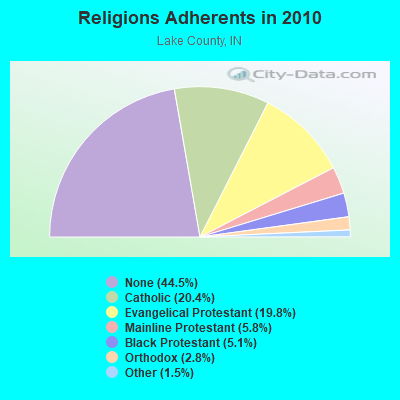
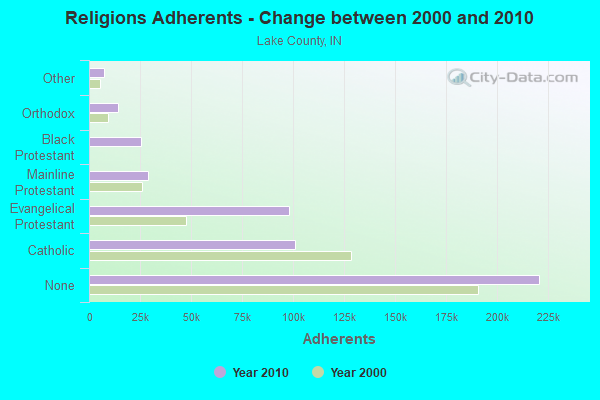
| Religion | Adherents | Congregations |
|---|---|---|
| Catholic | 101,096 | 58 |
| Evangelical Protestant | 98,213 | 266 |
| Mainline Protestant | 28,943 | 78 |
| Black Protestant | 25,459 | 74 |
| Orthodox | 13,990 | 14 |
| Other | 7,460 | 29 |
| None | 220,844 | - |
Food Environment Statistics:
| Lake County: | 1.67 / 10,000 pop. |
| Indiana: | 1.73 / 10,000 pop. |
| Lake County: | 0.08 / 10,000 pop. |
| Indiana: | 0.21 / 10,000 pop. |
| Lake County: | 0.61 / 10,000 pop. |
| Indiana: | 0.50 / 10,000 pop. |
| Lake County: | 3.56 / 10,000 pop. |
| Indiana: | 3.57 / 10,000 pop. |
| This county: | 5.86 / 10,000 pop. |
| State: | 6.78 / 10,000 pop. |
| Lake County: | 10.8% |
| State: | 9.2% |
| Lake County: | 32.3% |
| Indiana: | 29.0% |
| Lake County: | 11.7% |
| State: | 14.3% |
Health and Nutrition:
| This city: | 51.3% |
| State: | 49.3% |
| Here: | 49.6% |
| Indiana: | 46.2% |
| Here: | 28.6 |
| Indiana: | 28.7 |
| This city: | 21.3% |
| Indiana: | 21.3% |
| St. John: | 7.9% |
| Indiana: | 10.6% |
| Here: | 6.8 |
| State: | 6.8 |
| St. John: | 36.2% |
| Indiana: | 33.9% |
| St. John: | 57.9% |
| Indiana: | 56.1% |
| St. John: | 79.2% |
| Indiana: | 78.7% |
More about Health and Nutrition of St. John, IN Residents
St. John government finances - Expenditure in 2021 (per resident):
- Construction - General - Other: $253,000 ($11.07)
- Current Operations - General - Other: $5,624,000 ($246.16)
Sewerage: $3,934,000 ($172.19)
Police Protection: $3,263,000 ($142.82)
Water Utilities: $2,713,000 ($118.75)
Solid Waste Management: $2,018,000 ($88.33)
Regular Highways: $1,673,000 ($73.23)
Local Fire Protection: $1,550,000 ($67.84)
Central Staff Services: $1,521,000 ($66.57)
Parks and Recreation: $464,000 ($20.31)
General Public Buildings: $443,000 ($19.39)
Miscellaneous Commercial Activities - Other: $147,000 ($6.43)
Financial Administration: $142,000 ($6.22)
Health - Other: $14,000 ($0.61)
- General - Interest on Debt: $1,151,000 ($50.38)
- Intergovernmental to Local - Other - Central Staff Services: $15,000 ($0.66)
- Other Capital Outlay - Local Fire Protection: $41,000 ($1.79)
Police Protection: $33,000 ($1.44)
Parks and Recreation: $18,000 ($0.79)
General - Other: $5,000 ($0.22)
St. John government finances - Revenue in 2021 (per resident):
- Charges - Sewerage: $10,426,000 ($456.34)
Parks and Recreation: $793,000 ($34.71)
Other: $545,000 ($23.85)
- Local Intergovernmental - Highways: $342,000 ($14.97)
Other: $38,000 ($1.66)
- Miscellaneous - General Revenue - Other: $259,000 ($11.34)
Interest Earnings: $46,000 ($2.01)
Fines and Forfeits: $44,000 ($1.93)
Rents: $34,000 ($1.49)
Donations From Private Sources: $13,000 ($0.57)
- Revenue - Water Utilities: $6,960,000 ($304.64)
- State Intergovernmental - Highways: $1,603,000 ($70.16)
Other: $1,229,000 ($53.79)
General Local Government Support: $496,000 ($21.71)
Sewerage: $450,000 ($19.70)
Water Utilities: $450,000 ($19.70)
- Tax - Property: $6,720,000 ($294.13)
Other License: $992,000 ($43.42)
Public Utilities Sales: $300,000 ($13.13)
Occupation and Business License - Other: $120,000 ($5.25)
Other Selective Sales: $5,000 ($0.22)
St. John government finances - Debt in 2021 (per resident):
- Long Term Debt - Beginning Outstanding - Unspecified Public Purpose: $24,134,000 ($1056.33)
Outstanding Unspecified Public Purpose: $24,134,000 ($1056.33)
St. John government finances - Cash and Securities in 2021 (per resident):
- Bond Funds - Cash and Securities: $1,720,000 ($75.28)
- Other Funds - Cash and Securities: $25,254,000 ($1105.35)
- Sinking Funds - Cash and Securities: $879,000 ($38.47)
5.29% of this county's 2021 resident taxpayers lived in other counties in 2020 ($54,961 average adjusted gross income)
| Here: | 5.29% |
| Indiana average: | 6.66% |
0.01% of residents moved from foreign countries ($91 average AGI)
Lake County: 0.01% Indiana average: 0.00%
Top counties from which taxpayers relocated into this county between 2020 and 2021:
| from Cook County, IL | |
| from Porter County, IN | |
| from Will County, IL |
Businesses in St. John, IN
- ALDI: 1
Strongest AM radio stations in St. John:
- WLS (890 AM; 50 kW; CHICAGO, IL; Owner: WLS, INC.)
- WIND (560 AM; 5 kW; CHICAGO, IL; Owner: TICHENOR LICENSE CORPORATION ("TLC"))
- WVIV (1200 AM; 20 kW; CHICAGO, IL; Owner: WLXX-AM LICENSE CORP.)
- WYLL (1160 AM; 50 kW; CHICAGO, IL; Owner: SCA LICENSE CORPORATION)
- WMVP (1000 AM; 50 kW; CHICAGO, IL; Owner: ABC, INC.)
- WSCR (670 AM; 50 kW; CHICAGO, IL; Owner: INFINITY BROADCASTING OPERATIONS, INC.)
- WGN (720 AM; 50 kW; CHICAGO, IL; Owner: WGN CONTINENTAL BROADCASTING CO.)
- WNTD (950 AM; 5 kW; CHICAGO, IL; Owner: RADIO UNICA OF CHICAGO LICENSE CORP.)
- WBBM (780 AM; 50 kW; CHICAGO, IL; Owner: INFINITY BROADCASTING OPERATIONS, INC.)
- WNDZ (750 AM; daytime; 5 kW; PORTAGE, IN; Owner: ENTRAVISION HOLDINGS, LLC)
- WWCA (1270 AM; 1 kW; GARY, IN; Owner: METRO COMMUNICATIONS, INC.)
- WCGO (1600 AM; 1 kW; CHICAGO HEIGHTS, IL)
- WNWI (1080 AM; 3 kW; OAK LAWN, IL; Owner: BIRACH BROADCASTING CORPORATION)
Strongest FM radio stations in St. John:
- WZVN (107.1 FM; LOWELL, IN; Owner: M & M BROADCASTING, INC.)
- WBMF (88.1 FM; CRETE, IL; Owner: AMERICAN FAMILY ASSOCIATION)
- WYBA (102.3 FM; CRETE, IL; Owner: DONTRON INC.)
- WYCA (106.3 FM; LANSING, IL; Owner: DONTRON, INC.)
- WCKG (105.9 FM; ELMWOOD PARK, IL; Owner: INFINITY HOLDINGS CORPORATION OF ORLANDO)
- WLIT-FM (93.9 FM; CHICAGO, IL; Owner: AMFM RADIO LICENSES, L.L.C.)
- WPWX (92.3 FM; HAMMOND, IN; Owner: DONTRON, INC.)
- WJMK (104.3 FM; CHICAGO, IL; Owner: INFINITY BROADCASTING CORP. OF ILLINOIS)
- WNUA (95.5 FM; CHICAGO, IL; Owner: AMFM RADIO LICENSES, L.L.C.)
- WTMX (101.9 FM; SKOKIE, IL; Owner: BONNEVILLE HOLDING COMPANY)
- WBBM-FM (96.3 FM; CHICAGO, IL; Owner: INFINITY BROADCASTING OPERATIONS, INC.)
- WKSC-FM (103.5 FM; CHICAGO, IL; Owner: AMFM RADIO LICENSES, L.L.C.)
- WFMT (98.7 FM; CHICAGO, IL; Owner: WINDOW TO THE WORLD COMMUNICATIONS)
- WZZN (94.7 FM; CHICAGO, IL; Owner: ABC CHICAGO FM RADIO,INC.)
- WGCI-FM (107.5 FM; CHICAGO, IL; Owner: AMFM RADIO LICENSES, L.L.C.)
- WBEZ (91.5 FM; CHICAGO, IL; Owner: THE WBEZ ALLIANCE, INC.)
- WKQX (101.1 FM; CHICAGO, IL; Owner: EMMIS RADIO LICENSE CORPORATION)
- WLUP-FM (97.9 FM; CHICAGO, IL; Owner: BONNEVILLE HOLDING COMPANY)
- WNND (100.3 FM; CHICAGO, IL; Owner: BONNEVILLE HOLDING COMPANY)
- WOJO (105.1 FM; EVANSTON, IL; Owner: TICHENOR LICENSE CORPORATION ("TLC"))
TV broadcast stations around St. John:
- WYIN (Channel 56; GARY, IN; Owner: NORTHWEST INDIANA PUBLIC BROADCASTING, INC.)
- WLS-TV (Channel 7; CHICAGO, IL; Owner: WLS TELEVISION, INC.)
- WMAQ-TV (Channel 5; CHICAGO, IL; Owner: NBC SUBSIDIARY (WMAQ-TV), INC.)
- WTTW (Channel 11; CHICAGO, IL; Owner: WINDOW TO THE WORLD COMMUNICATIONS, INC.)
- WGN-TV (Channel 9; CHICAGO, IL; Owner: WGN CONTINENTAL BROADCASTING COMPANY)
- WGBO-TV (Channel 66; JOLIET, IL; Owner: WGBO LICENSE PARTNERSHIP, G.P.)
- WBBM-TV (Channel 2; CHICAGO, IL; Owner: CBS BROADCASTING INC.)
- WPWR-TV (Channel 50; GARY, IN; Owner: FOX TELEVISION STATIONS, INC.)
- WXFT (Channel 60; AURORA, IL; Owner: TELEFUTURA CHICAGO LLC)
- WCPX (Channel 38; CHICAGO, IL; Owner: PAXSON CHICAGO LICENSE, INC.)
- WCIU-TV (Channel 26; CHICAGO, IL; Owner: WCIU-TV LIMITED PARTNERSHIP)
- WFLD (Channel 32; CHICAGO, IL; Owner: FOX TELEVISION STATIONS, INC.)
- W68DO (Channel 68; PALATINE, IL; Owner: TRINITY BROADCASTING NETWORK)
- WFBT-CA (Channel 23; CHICAGO, IL; Owner: CHANNEL 23 LIMITED PARTNERSHIP)
- WJYS (Channel 62; HAMMOND, IN; Owner: JOVON BROADCASTING CORPORATION)
- WSNS-TV (Channel 44; CHICAGO, IL; Owner: TELEMUNDO OF CHICAGO, INC.)
- WOCH-LP (Channel 28; CHICAGO, IL; Owner: KM LPTV OF CHICAGO-28, L.L.C.)
- WYCC (Channel 20; CHICAGO, IL; Owner: COLLEGE DIST. #508, COUNTY OF COOK)
- WOCK-CA (Channel 13; CHICAGO, IL; Owner: KM LPTV OF CHICAGO-13, L.L.C.)
- W34CK (Channel 34; ARLINGTON HEIGHTS, IL; Owner: FIRST UNITED, INC.)
- W54AP (Channel 54; BLUE ISLAND, IL; Owner: CATHOLIC VIEWS BROADCASTS, INC.)
- W24AW (Channel 24; VALPARAISO, IN; Owner: LESEA BROADCASTING CORPORATION)
- W54BK (Channel 54; CHESTERTON, IN; Owner: LESEA BROADCASTING CORPORATION)
- W18AT (Channel 18; GARY, IN; Owner: LESEA BROADCASTING CORPORATION)
- National Bridge Inventory (NBI) Statistics
- 13Number of bridges
- 69ft / 20.9mTotal length
- $1,792,000Total costs
- 93,730Total average daily traffic
- 6,919Total average daily truck traffic
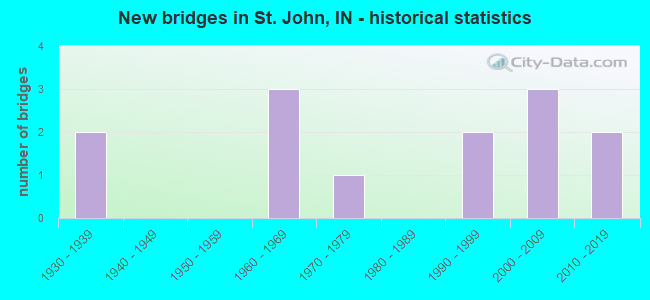
- New bridges - historical statistics
- 21930-1939
- 31960-1969
- 11970-1979
- 21990-1999
- 32000-2009
- 22010-2019
FCC Registered Antenna Towers:
11 (See the full list of FCC Registered Antenna Towers in St. John)FCC Registered Broadcast Land Mobile Towers:
5- Public Safety Building 11033 W. 93rd Ave. (Lat: 41.450000 Lon: -87.467833), Type: Pole, Structure height: 6 m, Overall height: 9 m, Call Sign: WQGT211,
Assigned Frequencies: 1.67000 MHz, Grant Date: 01/27/2017, Expiration Date: 04/10/2027, Certifier: Michael S Fryzel, Registrant: Information Station Specialists, Zeeland, MI 49464, Phone: (616) 772-2300
- GATES ELEVATED TANK, Gates Elevated Tank Near The Jct. Of Sagebrook & Bridlewood (Gates Subdivision) (Lat: 41.424000 Lon: -87.444167), Type: Tank, Structure height: 48 m, Call Sign: WQIX903,
Assigned Frequencies: 451.062 MHz, Grant Date: 05/15/2018, Expiration Date: 06/16/2028, Certifier: Stephen Z Kil, Registrant: Town Of St John, 10955 W 93rd Ave, St John, IN 46373, Phone: (219) 365-6191, Email:
- McDonald\'s #35767, 9769 Wicker Avenue (Lat: 41.441389 Lon: -87.469167), Call Sign: WQUZ363,
Assigned Frequencies: 31.2400 MHz, 33.1600 MHz, 33.4000 MHz, 35.0200 MHz, 154.540 MHz, 457.512 MHz, 457.537 MHz, 457.562 MHz, 457.587 MHz, 464.012 MHz... (+21 more), Grant Date: 11/25/2014, Expiration Date: 11/25/2024, Certifier: Laura Nicholson, Registrant: Dolfen Consulting Group, 95 Willow Lane, Bristol, IL 60512-9711, Phone: (630) 251-9161, Fax: (630) 566-1755, Email:
- CEDAR CREEK, Cedar Creek Golf Course - Part Of The Se 1/4,Nw 1/4,Section 9, T34n,R9w (Lat: 41.414056 Lon: -87.461806), Type: Ltower, Structure height: 91.4 m, Overall height: 96 m, Call Sign: WQWI210,
Assigned Frequencies: 154.175 MHz, Grant Date: 08/27/2015, Expiration Date: 09/27/2015, Cancellation Date: 11/28/2015, Certifier: Brian Hitchcock, Registrant: Mazzitello Professional Services Mps LLC, N7427 330th Street, Spring Valley, WI 54767, Phone: (715) 222-4440, Email:
- CEDAR CREEK, Part Of The Se 1/4,Nw 1/4,Section 9, T34n,R9w, Lake County In (Lat: 41.414056 Lon: -87.461806), Type: Ltower, Structure height: 91.4 m, Overall height: 96 m, Call Sign: WQWX397,
Assigned Frequencies: 154.815 MHz, Grant Date: 12/16/2015, Expiration Date: 12/16/2025, Certifier: Brian Hitchcock, Registrant: Spectrum And Licensing Services, 141 Lee Street, Hanover, PA 17331, Phone: (717) 630-0816, Fax: (717) 637-8300, Email:
FCC Registered Microwave Towers:
6- ST, JOHN, Lat: 41.423611 Lon: -87.461111, Call Sign: WQOC879,
Assigned Frequencies: 956.431 MHz, Grant Date: 08/16/2011, Expiration Date: 08/16/2021, Cancellation Date: 10/16/2021, Certifier: Kenya Johnson, Registrant: Sensus, 450 N Gallatin Avenue, Uniontown, PA 15401, Phone: (800) 638-3748, Fax: (800) 888-2403, Email:
- AT304651, 10870 West 93rd Street ( St John In 7# 304651) (Lat: 41.450472 Lon: -87.465583), Type: Ltower, Structure height: 76.2 m, Overall height: 80.5 m, Call Sign: WQQS335,
Assigned Frequencies: 6004.50 MHz, 6725.00 MHz, Grant Date: 02/21/2013, Expiration Date: 02/21/2023, Cancellation Date: 05/12/2016, Certifier: Brian Higgins, Registrant: Eg Broadcast Newco Corp, 1209 Orange St, Wilmington, DE 19801, Phone: (212) 464-2568, Email:
- CEDAR CREEK, Part Of The Se 1/4,Nw 1/4,Section 9, T34n,R9w, Lake County In (Lat: 41.414083 Lon: -87.461833), Type: Ltower, Structure height: 91.4 m, Overall height: 96 m, Call Sign: WQWH768, Licensee ID: L01961691,
Assigned Frequencies: 6063.80 MHz, 6063.80 MHz, 6063.80 MHz, 6063.80 MHz, Grant Date: 08/26/2015, Expiration Date: 08/26/2025, Certifier: Brian Hitchcock, Registrant: Lake County Indiana 911, 2293 N Main Street, Crown Point, IN 46307, Phone: (219) 755-6501, Email:
- CEDAR CREEK, Part Of The Se 1/4,Nw 1/4,Section 9, T34n,R9w, Lake County In (Lat: 41.414083 Lon: -87.461833), Type: Ltower, Structure height: 91.4 m, Overall height: 96 m, Call Sign: WQWK989, Licensee ID: L01961691,
Assigned Frequencies: 6004.50 MHz, 6004.50 MHz, 6004.50 MHz, 6004.50 MHz, Grant Date: 09/24/2015, Expiration Date: 09/24/2025, Certifier: Brian Hitchcock, Registrant: Lake County Indiana 911, 2293 N Main Street, Crown Point, IN 46307, Phone: (219) 755-6501, Email:
- BINGO LAKE, Alexander St And W 85th Ave (Lat: 41.464917 Lon: -87.464806), Type: Mtower, Structure height: 53.3 m, Call Sign: WRYB615, Licensee ID: L00004803,
Assigned Frequencies: 11285.0 MHz, 11285.0 MHz, 11285.0 MHz, 11285.0 MHz, 11285.0 MHz, 11285.0 MHz, 11285.0 MHz, 11285.0 MHz, 11285.0 MHz, 11285.0 MHz, 11285.0 MHz, Grant Date: 07/20/2023, Expiration Date: 07/20/2033, Certifier: Clifford Burns, Registrant: Northern Indiana Public Service Company, 801 East 86th Ave, Merrillville, IN 46410, Phone: (219) 781-7261, Fax: (219) 886-5844, Email:
- KREIGHTSBURG, 1450 Ft E Of Us 41 And 1000 Ft S Of Us 231 2.0 Mi S Of (Lat: 41.418083 Lon: -87.464750), Type: Mast, Structure height: 53.6 m, Call Sign: WHJ971, Licensee ID: L00004803,
Assigned Frequencies: 6735.00 MHz, Grant Date: 09/14/2018, Expiration Date: 09/30/2028, Registrant: Northern Indiana Public Service Company, 801 East 86th Ave, Merrillville, IN 46410, Phone: (219) 781-7261, Fax: (219) 886-5844, Email:
FCC Registered Amateur Radio Licenses:
2- Call Sign: W9GWR, Previous Call Sign: KG9CG, Licensee ID: L00151844, Grant Date: 02/12/2020, Expiration Date: 03/07/2030, Certifier: George W Reichert, Registrant: George W Reichert, 14733 Coral St., St. John, IN 46311
- Call Sign: KD9CGX, Licensee ID: L01897922, Grant Date: 10/14/2014, Expiration Date: 10/14/2024, Certifier: Richard W Erman, Registrant: Richard W Erman, 12166 W 95th Place, St. John, IN 46373
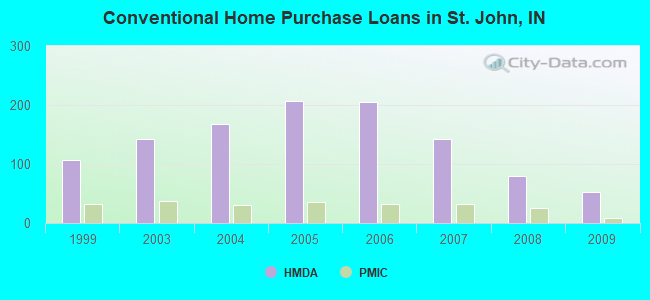
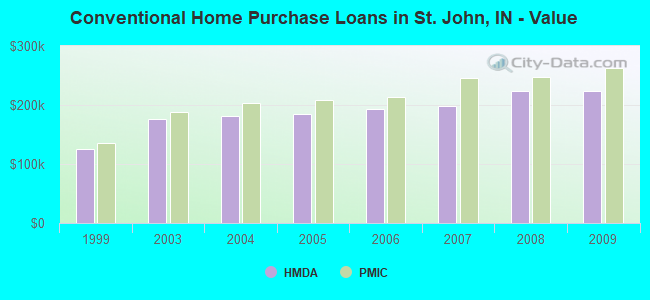
| Home Mortgage Disclosure Act Aggregated Statistics For Year 2009 (Based on 2 partial tracts) | ||||||||||||
| A) FHA, FSA/RHS & VA Home Purchase Loans | B) Conventional Home Purchase Loans | C) Refinancings | D) Home Improvement Loans | F) Non-occupant Loans on < 5 Family Dwellings (A B C & D) | G) Loans On Manufactured Home Dwelling (A B C & D) | |||||||
|---|---|---|---|---|---|---|---|---|---|---|---|---|
| Number | Average Value | Number | Average Value | Number | Average Value | Number | Average Value | Number | Average Value | Number | Average Value | |
| LOANS ORIGINATED | 20 | $220,604 | 52 | $223,053 | 363 | $199,033 | 9 | $111,053 | 4 | $222,375 | 1 | $155,020 |
| APPLICATIONS APPROVED, NOT ACCEPTED | 2 | $216,925 | 3 | $243,830 | 31 | $215,761 | 0 | $0 | 0 | $0 | 0 | $0 |
| APPLICATIONS DENIED | 2 | $187,635 | 6 | $271,672 | 79 | $225,507 | 4 | $127,212 | 1 | $114,820 | 0 | $0 |
| APPLICATIONS WITHDRAWN | 1 | $360,570 | 2 | $263,310 | 50 | $228,742 | 2 | $198,805 | 2 | $146,865 | 1 | $97,660 |
| FILES CLOSED FOR INCOMPLETENESS | 1 | $195,640 | 2 | $189,510 | 15 | $223,039 | 1 | $158,580 | 0 | $0 | 0 | $0 |
Detailed HMDA statistics for the following Tracts: 0426.03 , 0426.05
| Private Mortgage Insurance Companies Aggregated Statistics For Year 2009 (Based on 2 partial tracts) | ||||
| A) Conventional Home Purchase Loans | B) Refinancings | |||
|---|---|---|---|---|
| Number | Average Value | Number | Average Value | |
| LOANS ORIGINATED | 9 | $262,257 | 11 | $251,940 |
| APPLICATIONS APPROVED, NOT ACCEPTED | 3 | $246,843 | 5 | $252,718 |
| APPLICATIONS DENIED | 3 | $117,813 | 4 | $244,420 |
| APPLICATIONS WITHDRAWN | 0 | $0 | 3 | $288,797 |
| FILES CLOSED FOR INCOMPLETENESS | 0 | $0 | 0 | $0 |
Detailed PMIC statistics for the following Tracts: 0426.03 , 0426.05
2003 - 2011 National Fire Incident Reporting System (NFIRS) incidents
- Fire incident types reported to NFIRS in St. John, IN
- 21856.9%Outside Fires
- 7720.1%Structure Fires
- 4411.5%Mobile Property/Vehicle Fires
- 4411.5%Other
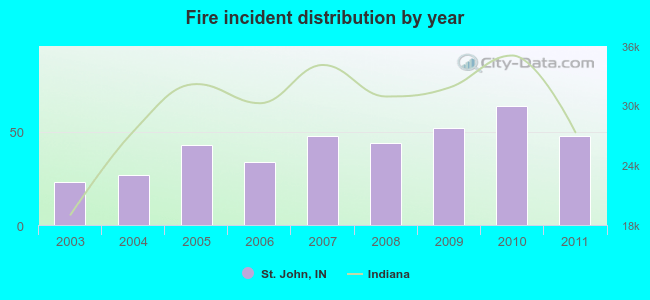 According to the data from the years 2003 - 2011 the average number of fire incidents per year is 43. The highest number of reported fire incidents - 64 took place in 2010, and the least - 23 in 2003. The data has an increasing trend.
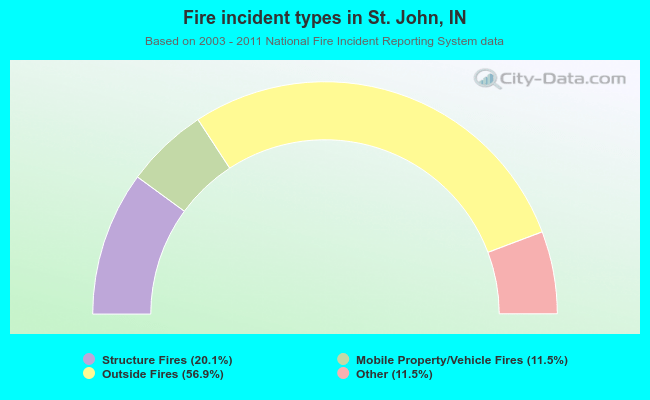 When looking into fire subcategories, the most incidents belonged to: Outside Fires (56.9%), and Structure Fires (20.1%).
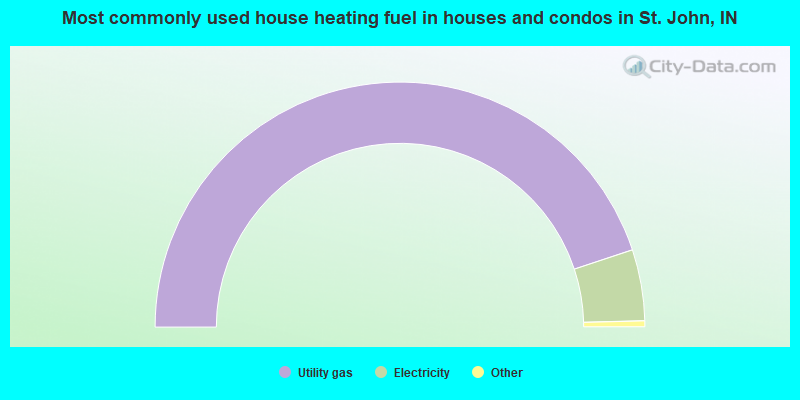
- 89.8%Utility gas
- 9.4%Electricity
- 0.4%Bottled, tank, or LP gas
- 0.3%Wood
- 0.2%No fuel used
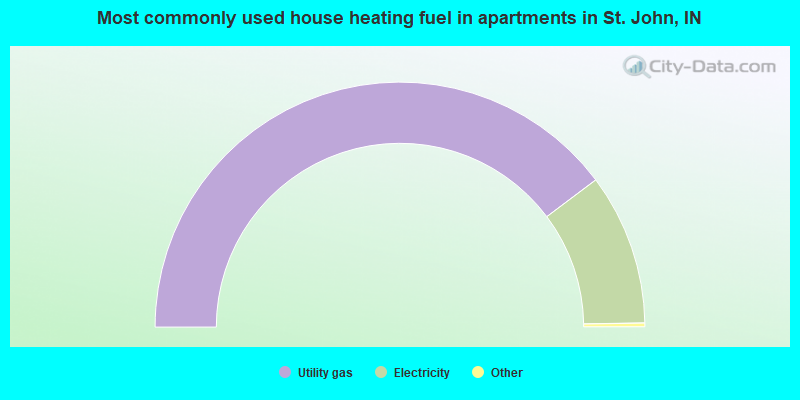
- 79.9%Utility gas
- 20.1%Electricity
St. John compared to Indiana state average:
- Median household income above state average.
- Median house value above state average.
- Unemployed percentage significantly below state average.
- Hispanic race population percentage significantly above state average.
- Foreign-born population percentage significantly above state average.
- Renting percentage significantly below state average.
- House age significantly below state average.
- Number of college students above state average.
- Percentage of population with a bachelor's degree or higher above state average.
St. John on our top lists:
- #59 on the list of "Top 101 cities with the most people living the same house as 1 year ago (population 5,000+))"
- #2 on the list of "Top 101 counties with the highest carbon monoxide air pollution readings in 2012 (ppm)"
- #5 on the list of "Top 101 counties with the lowest percentage of residents that visited a dentist within the past year"
- #6 on the list of "Top 101 counties with the lowest percentage of residents relocating from foreign countries between 2010 and 2011"
- #8 on the list of "Top 101 counties with the highest average weight of females"
- #13 on the list of "Top 101 counties with the most Orthodox adherents (pop. 50,000+)"

|
|
Total of 107 patent applications in 2008-2024.