Strawberry Plains: Fire Incidents, Tennessee (TN)
Where are fire incidents reported in Strawberry Plains, TN
Something went wrong! Please refresh the page.
|
| |||||||||||||||||||||||||||||||||||||||||||||||||||||||||||||||||||||||||||||||||||||||||||||||||||||||||||||
2002 - 2018 National Fire Incident Reporting System (NFIRS) incidents
- Incident types reported to NFIRS in Strawberry Plains, TN
- 82046.5%Rescue & EMS
- 38321.7%Fire
- 22612.8%Good Intent Call
- 1407.9%Hazardous Condition
- 1237.0%Service Call
- 683.9%False Alarm
- 20.1%Overpressure Rupture
- 20.1%Special Incident
- Fire incident types reported to NFIRS in Strawberry Plains, TN
- 14337.3%Structure Fires
- 13635.5%Outside Fires
- 9224.0%Mobile Property/Vehicle Fires
- 123.1%Other
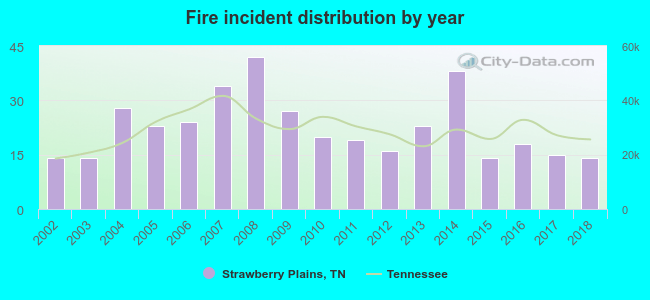 According to the data from the years 2002 - 2018 the average number of fires per year is 23. The highest number of fires - 42 took place in 2008, and the least - 14 in 2002. The data has a constant trend.
The average number of yearly fire incidents per 10k residents in Strawberry Plains, TN compared to nearest cities:
(Note: Based on data for the last 3 years, including only cities with population 5,000 and above)
| Strawberry Plains: | 29.7 |
| Jefferson City: | 55.4 |
| Sevierville: | 183.4 |
| Seymour: | 67.2 |
| Knoxville: | 70.0 |
| Pigeon Forge: | 125.0 |
| Morristown: | 46.5 |
| Powell: | 21.2 |
| Bean Station: | 20.9 |

 Based on the data from the years 2002 - 2018 the average number of fire-related yearly casualties is 0. The highest number of injuries - 1 took place in 2007, and the lowest - 0 in 2002. The data has a growing trend.
 30.8% incidents where reported in the morning and 69.2% in the evening. The most fires (15.7%) took place on Monday, and the least (13.1%) on Wednesday.
 According to the 383 incident reports from years 2002 - 2018 most fires (11.2%) took place during January, and the least (6.0%) in August.
 Out of all 1,764 cases reported during the years 2002 - 2018, the most belonged to the categories: Rescue & EMS (46.5%), Fire (21.7%), and Good Intent Call (12.8%).
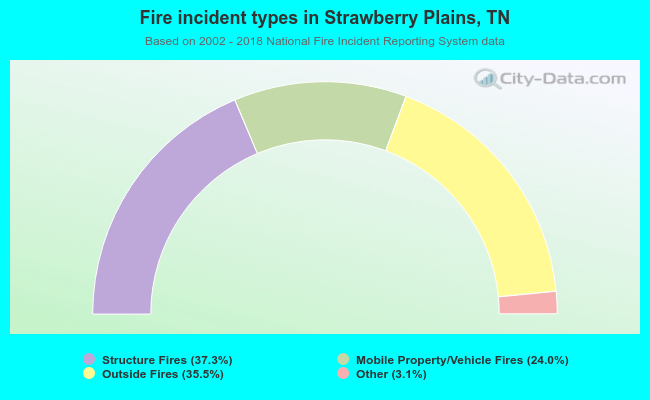 When looking into fire subcategories, the most incidents belonged to: Structure Fires (37.3%), and Outside Fires (35.5%).