Morristown: Fire Incidents, Tennessee (TN)
Where are fire incidents reported in Morristown, TN
Something went wrong! Please refresh the page.
| Fire incidents reported | |
|---|---|
| Sreet name | Count |
| ANDREW JOHNSON HWY | 430 |
| MORRIS BLVD | 196 |
| DAVY CROCKETT PKWY | 148 |
| CUMBERLAND ST | 98 |
| BUFFALO TR | 92 |
| INTERSTATE 81 | 88 |
| LIBERTY HILL RD | 84 |
| ANDREW JOHNSON | 76 |
| POPE RD | 68 |
| LINCOLN AV | 64 |
| ECONOMY RD | 62 |
| COMMERCE BLVD | 60 |
| FISH HATCHERY ROAD | 60 |
| MCFARLAND ST | 56 |
| DAVY CROCKETT PKY | 50 |
| 1ST NORTH ST | 44 |
| MAIN ST | 44 |
| ELWOOD DR | 42 |
| HWY 160 | 40 |
| BRIGHTS PKE | 38 |
| ENKA HIGHWAY | 38 |
| CHEROKEE DR | 36 |
| BARKLEY LANDING DR | 34 |
| SULPHUR SPRINGS RD | 34 |
| 4TH NORTH ST | 32 |
| SUBLETT RD | 32 |
| SULPHUR SPRINGS ROAD | 32 |
| FAIRMONT AV | 30 |
| BRIGHTS PIKE | 28 |
| 2ND NORTH ST | 26 |
| Other | 1,123 |
2002 - 2018 National Fire Incident Reporting System (NFIRS) incidents
- Incident types reported to NFIRS in Morristown, TN
- 11,56162.9%Rescue & EMS
- 3,28517.9%Fire
- 2,04911.1%False Alarm
- 7404.0%Hazardous Condition
- 4562.5%Good Intent Call
- 2431.3%Service Call
- 240.1%Special Incident
- 220.1%Overpressure Rupture
- Fire incident types reported to NFIRS in Morristown, TN
- 1,26338.4%Outside Fires
- 1,21937.1%Structure Fires
- 55416.9%Mobile Property/Vehicle Fires
- 2497.6%Other
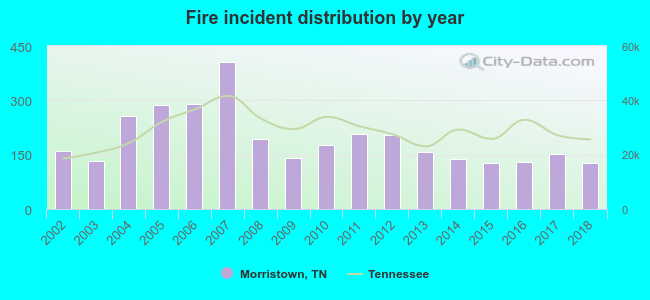 Based on the data from the years 2002 - 2018 the average number of fires per year is 193. The highest number of fire incidents - 407 took place in 2007, and the least - 126 in 2015. The data has a decreasing trend.
The average number of yearly fire incidents per 10k residents in Morristown, TN compared to nearest cities:
(Note: Based on data for the last 3 years, including only cities with population 5,000 and above)
| Morristown: | 46.5 |
| Bean Station: | 20.9 |
| Jefferson City: | 55.4 |
| Newport: | 185.1 |
| Strawberry Plains: | 29.7 |
| Greeneville: | 133.0 |
| Sevierville: | 183.4 |
| Pigeon Forge: | 125.0 |
| Seymour: | 67.2 |
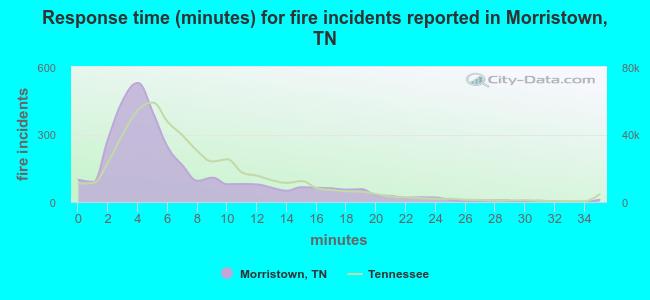 The median response time based on all reported fire incidents is 5 minutes. This is lower than the state median value.
The median response time in Morristown, TN compared to nearest cities:
(Note: Based on data for all years, including only cities with at least 500 fire incidents)
| Morristown: | 5 minutes |
| Jefferson City: | 5 minutes |
| Dandridge: | 10 minutes |
| New Market: | 6 minutes |
| Newport: | 7 minutes |
| Parrottsville: | 12 minutes |
| Mosheim: | 9 minutes |
| Rogersville: | 10 minutes |
| Tazewell: | 10 minutes |
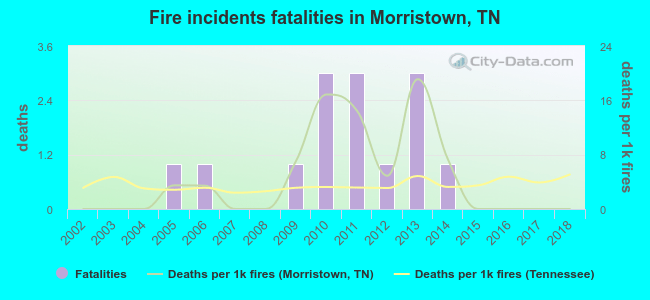 Based on the reports from the years 2002 - 2018 the average number of fire-related yearly deaths is 1. The highest number of reported deaths - 3 took place in 2010, and the lowest - 0 in 2002. The data has a constant trend.
The average number of fatalities per 1,000 fires is 5. This indicator was the highest - 19 in 2013, and the lowest 0 in 2002. The trend for deaths per 1,000 fire incidents is constant. Compared to the state value the number of deaths per 1,000 incidents is higher.
Based on the reports from the years 2002 - 2018 the average number of fire-related yearly deaths is 1. The highest number of reported deaths - 3 took place in 2010, and the lowest - 0 in 2002. The data has a constant trend.
The average number of fatalities per 1,000 fires is 5. This indicator was the highest - 19 in 2013, and the lowest 0 in 2002. The trend for deaths per 1,000 fire incidents is constant. Compared to the state value the number of deaths per 1,000 incidents is higher.Deaths per 1,000 incidents in Morristown, TN compared to nearest cities:
(Note: Based on data for all years, including only cities with at least 2,500 fire incidents)
| Morristown: | 4.3 |
| Greeneville: | 3.6 |
| Sevierville: | 2.7 |
| Gatlinburg: | 5.2 |
| Knoxville: | 2.1 |
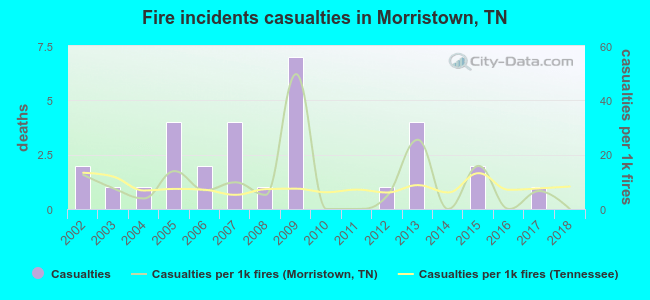 Based on the reports from the years 2002 - 2018 the average number of fire-related yearly casualties is 2. The highest number of reported injuries - 7 took place in 2009, and the lowest - 0 in 2010. The data has a declining trend.
The average number of casualties per 1,000 fires is 10. This indicator was the highest - 50 in 2009, and the lowest 0 in 2010. The trend for casualties per 1,000 fire incidents is decreasing. Compared to the Tennessee value the number of injuries per 1,000 incidents is similar.
Based on the reports from the years 2002 - 2018 the average number of fire-related yearly casualties is 2. The highest number of reported injuries - 7 took place in 2009, and the lowest - 0 in 2010. The data has a declining trend.
The average number of casualties per 1,000 fires is 10. This indicator was the highest - 50 in 2009, and the lowest 0 in 2010. The trend for casualties per 1,000 fire incidents is decreasing. Compared to the Tennessee value the number of injuries per 1,000 incidents is similar.Casualties per 1,000 incidents in Morristown, TN compared to nearest cities:
(Note: Based on data for all years, including only cities with at least 500 fire incidents)
| Morristown: | 9.1 |
| Jefferson City: | 4.5 |
| Dandridge: | 3.3 |
| New Market: | 19.9 |
| Newport: | 0.4 |
| Parrottsville: | 3.6 |
| Mosheim: | 0.0 |
| Rogersville: | 3.1 |
| Tazewell: | 2.9 |
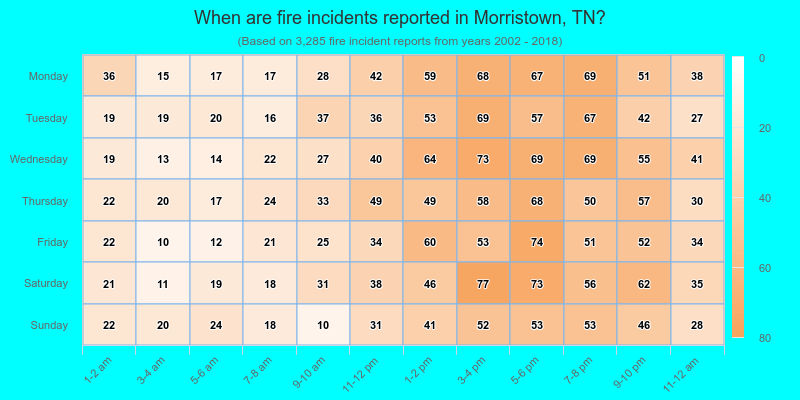
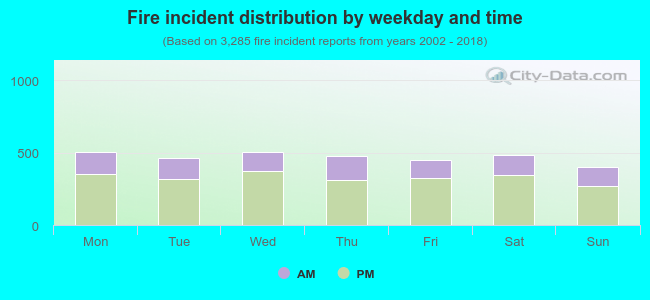 30.1% incidents where reported in the morning and 69.9% in the evening. The most fires (15.4%) took place on Monday, and the least (12.1%) on Sunday.
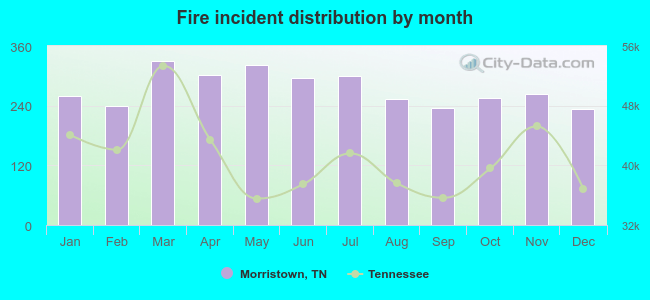 According to the 3,285 fire incidents from years 2002 - 2018 most fires (10.0%) took place during March, and the least (7.1%) in December.
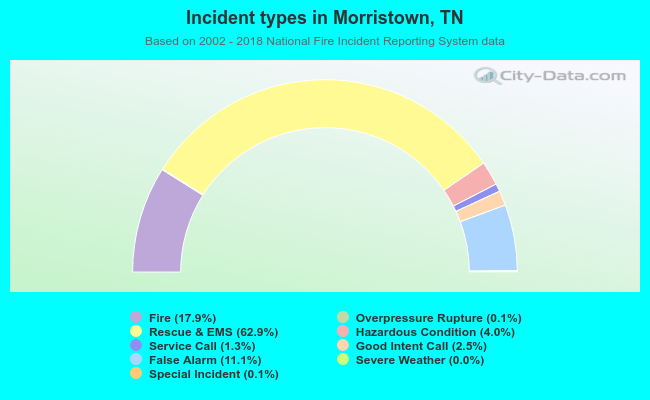 Out of all 18,384 cases reported during the years 2002 - 2018, the most belonged to the categories: Rescue & EMS (62.9%), Fire (17.9%), and False Alarm (11.1%).
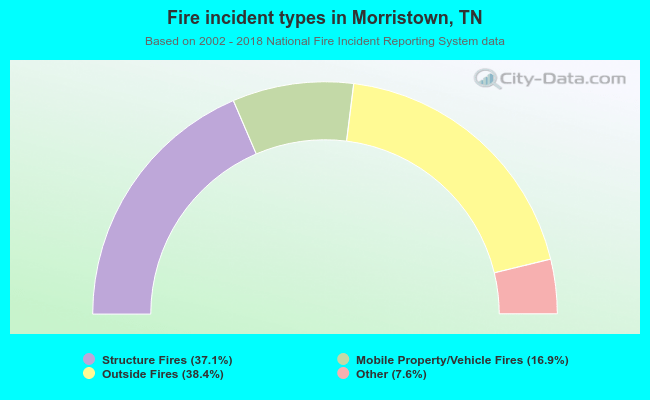 When looking into fire subcategories, the most reports belonged to: Outside Fires (38.4%), and Structure Fires (37.1%).