Streator: Fire Incidents, Illinois (IL)
Where are fire incidents reported in Streator, IL
Something went wrong! Please refresh the page.
| Fire incidents reported | |
|---|---|
| Sreet name | Count |
| EVERETT ST | 876 |
| MORRELL ST | 604 |
| BLOOMINGTON ST | 140 |
| MAIN ST | 136 |
| VERMILLION ST | 98 |
| SHABBONA ST | 76 |
| STERLING ST | 70 |
| WASSON ST | 70 |
| PARK ST | 66 |
| OTTER CREEK ST | 62 |
| EASTWOOD AVE | 58 |
| GRANT ST | 46 |
| MONROE ST | 46 |
| ILLINOIS ST | 42 |
| FIRST ST | 40 |
| FRECH ST | 40 |
| HICKORY ST | 40 |
| TWELFTH ST | 36 |
| BRIDGE ST | 34 |
| KENT ST | 32 |
| OAKLEY AVE | 32 |
| BROADWAY ST | 30 |
| JAMES ST | 26 |
| BAKER ST | 24 |
| CEDAR ST | 24 |
| WILSON ST | 24 |
| LA RUE ST | 22 |
| MARILLA PARK RD | 22 |
| AQUADUCT RD | 20 |
| BRONSON ST | 20 |
2002 - 2018 National Fire Incident Reporting System (NFIRS) incidents
- Incident types reported to NFIRS in Streator, IL
- 5,14242.5%Rescue & EMS
- 2,39619.8%Fire
- 1,55812.9%Service Call
- 1,52812.6%Hazardous Condition
- 9257.6%False Alarm
- 5004.1%Good Intent Call
- 320.3%Severe Weather
- 130.1%Special Incident
- Fire incident types reported to NFIRS in Streator, IL
- 1,48261.9%Structure Fires
- 61325.6%Outside Fires
- 2359.8%Mobile Property/Vehicle Fires
- 662.8%Other
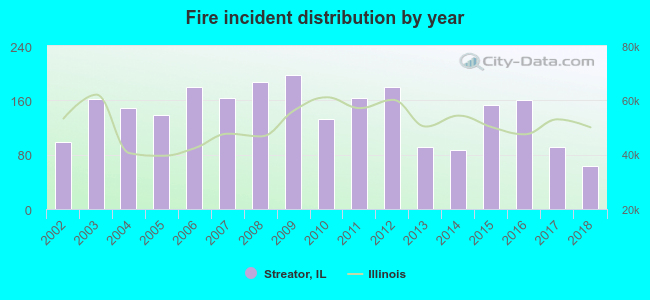 According to the data from the years 2002 - 2018 the average number of fires per year is 141. The highest number of fires - 197 took place in 2009, and the least - 63 in 2018. The data has a decreasing trend.
The average number of yearly fire incidents per 10k residents in Streator, IL compared to nearest cities:
(Note: Based on data for the last 3 years, including only cities with population 5,000 and above)
| Streator: | 79.0 |
| Ottawa: | 33.3 |
| Pontiac: | 58.9 |
| La Salle: | 2.7 |
| Peru: | 40.9 |
| Spring Valley: | 27.4 |
| Morris: | 101.4 |
| Coal City: | 71.2 |
| Mendota: | 56.5 |
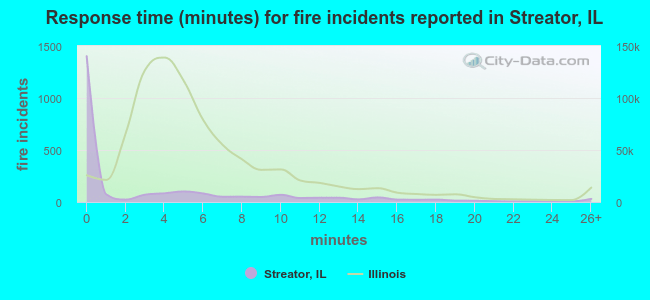 The median response time based on all reported fire incidents is NO DATA minutes. This is !!!ERROR!!! the Illinois median value.
The median response time in Streator, IL compared to nearest cities:
(Note: Based on data for all years, including only cities with at least 500 fire incidents)
| Streator: | 0 minutes |
| Ottawa: | 4 minutes |
| Marseilles: | 8 minutes |
| Pontiac: | 10 minutes |
| Dwight: | 11 minutes |
| Peru: | 9 minutes |
| Morris: | 9 minutes |
| Coal City: | 7 minutes |
| Mendota: | 8 minutes |
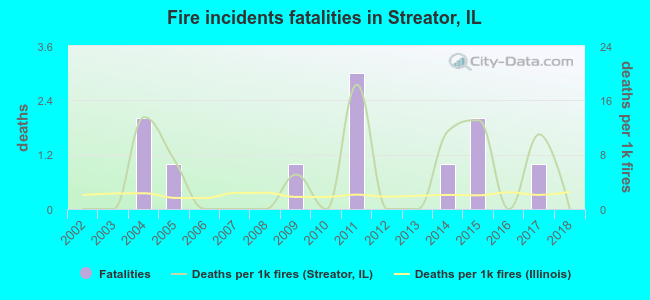 Based on the reports from the years 2002 - 2018 the average number of fire-related fatalities per year is 1. The highest number of reported deaths - 3 took place in 2011, and the lowest - 0 in 2002. The data has a constant trend.
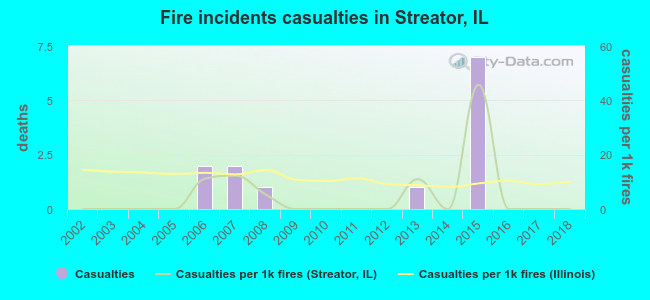 Based on the data from the years 2002 - 2018 the average number of fire-related casualties per year is 1. The highest number of reported casualties - 7 took place in 2015, and the lowest - 0 in 2002. The data has a constant trend.
The average number of injuries per 1,000 fire incidents is 5. This indicator was the highest - 46 in 2015, and the lowest 0 in 2002. The trend for injuries per 1,000 fire incidents is constant. Compared to the Illinois value the number of injuries per 1,000 incidents is much lower.
Based on the data from the years 2002 - 2018 the average number of fire-related casualties per year is 1. The highest number of reported casualties - 7 took place in 2015, and the lowest - 0 in 2002. The data has a constant trend.
The average number of injuries per 1,000 fire incidents is 5. This indicator was the highest - 46 in 2015, and the lowest 0 in 2002. The trend for injuries per 1,000 fire incidents is constant. Compared to the Illinois value the number of injuries per 1,000 incidents is much lower.
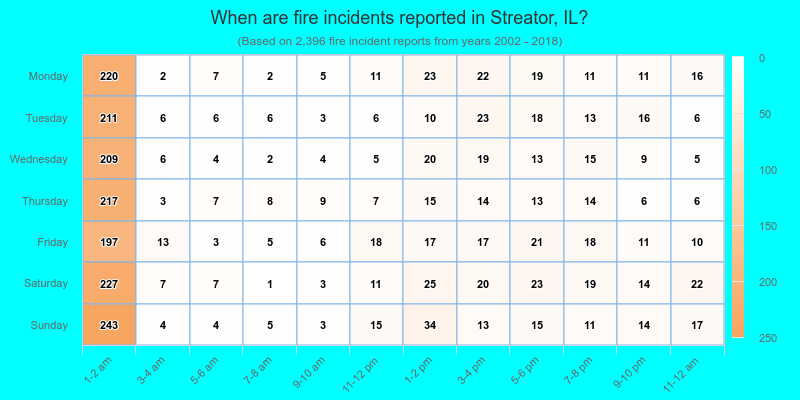
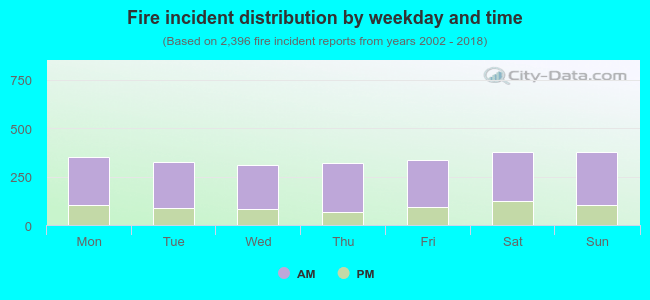 72.5% incidents where reported in the morning and 27.5% in the evening. The most fires (15.8%) took place on Saturday, and the least (13.0%) on Wednesday.
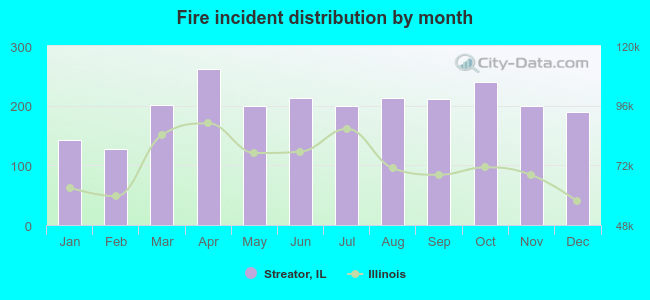 Based on the 2,396 incident reports from years 2002 - 2018 most fires (10.9%) took place during April, and the least (5.3%) in February.
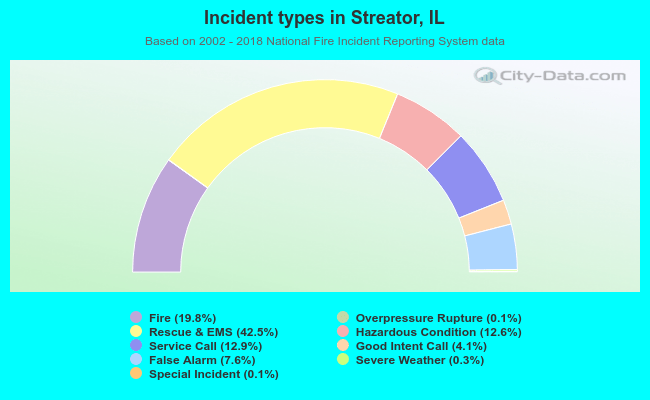 Out of all 12,102 cases reported during the years 2002 - 2018, the most belonged to the categories: Rescue & EMS (42.5%), Fire (19.8%), and Service Call (12.9%).
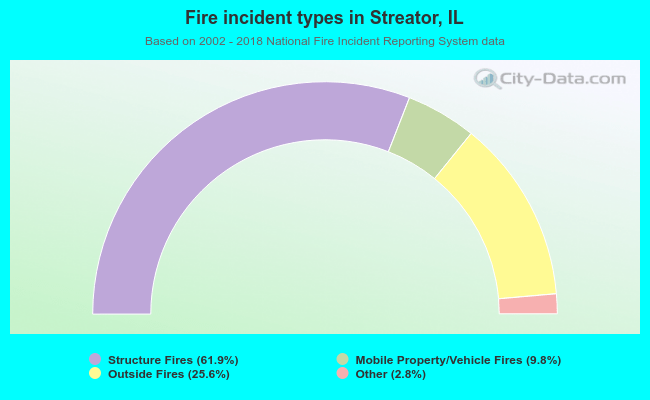 When looking into fire subcategories, the most incidents belonged to: Structure Fires (61.9%), and Outside Fires (25.6%).