Morris: Fire Incidents, Illinois (IL)
Where are fire incidents reported in Morris, IL
Something went wrong! Please refresh the page.
| Fire incidents reported | |
|---|---|
| Sreet name | Count |
| ASHTON RD | 274 |
| MAIN ST | 194 |
| I 80 | 118 |
| US ROUTE 6 | 90 |
| PINE BLUFF RD | 78 |
| DIVISION ST | 76 |
| ROUTE 47 | 72 |
| DWIGHT RD | 54 |
| WASHINGTON ST | 54 |
| ASHLEY RD | 52 |
| ARMSTRONG ST | 46 |
| DUPONT RD | 42 |
| LISBON RD | 42 |
| CEMETERY RD | 40 |
| SOUTHMOR RD | 40 |
| LIBERTY ST | 36 |
| MAIN | 34 |
| AIRPORT RD | 32 |
| JEFFERSON ST | 32 |
| MINOOKA RD | 32 |
| TABLER RD | 28 |
| ARMSTRONG | 26 |
| ASHTON | 26 |
| DRESDEN RD | 24 |
| GORE RD | 24 |
| GUN CLUB RD | 22 |
| PARK BLVD | 22 |
| OLD PINE BLUFF RD | 18 |
| TWILIGHT DR | 18 |
| WEITZ RD | 18 |
2002 - 2018 National Fire Incident Reporting System (NFIRS) incidents
- Incident types reported to NFIRS in Morris, IL
- 5,73052.5%Rescue & EMS
- 1,50413.8%Hazardous Condition
- 1,50113.8%Fire
- 7817.2%Service Call
- 7556.9%False Alarm
- 5735.3%Good Intent Call
- 330.3%Severe Weather
- 160.1%Overpressure Rupture
- 140.1%Special Incident
- Fire incident types reported to NFIRS in Morris, IL
- 79352.8%Structure Fires
- 49432.9%Outside Fires
- 18612.4%Mobile Property/Vehicle Fires
- 281.9%Other
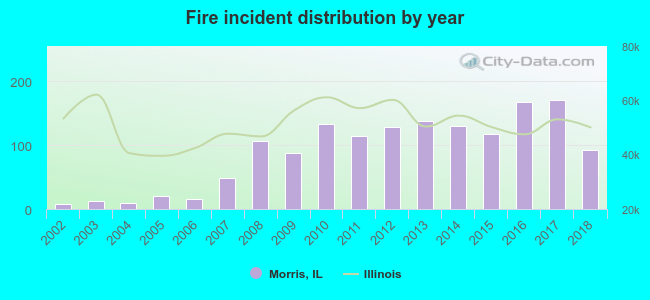 Based on the data from the years 2002 - 2018 the average number of fire incidents per year is 88. The highest number of fires - 170 took place in 2017, and the least - 8 in 2002. The data has a growing trend.
The average number of yearly fire incidents per 10k residents in Morris, IL compared to nearest cities:
(Note: Based on data for the last 3 years, including only cities with population 5,000 and above)
| Morris: | 101.4 |
| Coal City: | 71.2 |
| Minooka: | 54.8 |
| Channahon: | 43.1 |
| Braidwood: | 46.3 |
| Wilmington: | 146.5 |
| Shorewood: | 36.6 |
| Yorkville: | 42.2 |
| Joliet: | 28.1 |
 The median response time based on all reported fire incidents is 9 minutes. This is higher compared to the Illinois median value.
The median response time in Morris, IL compared to nearest cities:
(Note: Based on data for all years, including only cities with at least 500 fire incidents)
| Morris: | 9 minutes |
| Coal City: | 7 minutes |
| Minooka: | 7 minutes |
| Channahon: | 7 minutes |
| Braidwood: | 6 minutes |
| Marseilles: | 8 minutes |
| Wilmington: | 9 minutes |
| Shorewood: | 5 minutes |
| Elwood: | 7 minutes |
 According to the reports from the years 2002 - 2018 the average number of fire-related yearly casualties is 0. The highest number of reported injuries - 2 took place in 2012, and the lowest - 0 in 2002. The data has a constant trend.
The average number of casualties per 1,000 fire incidents is 3. This indicator was the highest - 16 in 2012, and the lowest 0 in 2002. The trend for injuries per 1,000 fire incidents is growing. Compared to the state value the number of casualties per 1,000 fire incidents is much lower.
According to the reports from the years 2002 - 2018 the average number of fire-related yearly casualties is 0. The highest number of reported injuries - 2 took place in 2012, and the lowest - 0 in 2002. The data has a constant trend.
The average number of casualties per 1,000 fire incidents is 3. This indicator was the highest - 16 in 2012, and the lowest 0 in 2002. The trend for injuries per 1,000 fire incidents is growing. Compared to the state value the number of casualties per 1,000 fire incidents is much lower.Casualties per 1,000 incidents in Morris, IL compared to nearest cities:
(Note: Based on data for all years, including only cities with at least 500 fire incidents)
| Morris: | 4.7 |
| Coal City: | 2.7 |
| Minooka: | 6.3 |
| Channahon: | 1.1 |
| Braidwood: | 1.7 |
| Marseilles: | 1.5 |
| Wilmington: | 5.8 |
| Shorewood: | 7.2 |
| Elwood: | 1.7 |
 32.9% incidents where reported in the morning and 67.1% in the evening. The most fires (15.7%) took place on Monday, and the least (13.3%) on Thursday.
 According to the 1,501 incident reports from years 2002 - 2018 most fires (11.5%) took place during April, and the least (5.6%) in December.
 Out of all 10,907 cases reported during the years 2002 - 2018, the most belonged to the categories: Rescue & EMS (52.5%), Hazardous Condition (13.8%), and Fire (13.8%).
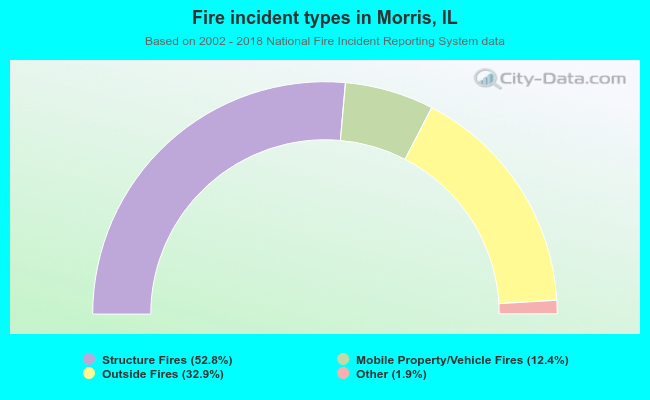 When looking into fire subcategories, the most incidents belonged to: Structure Fires (52.8%), and Outside Fires (32.9%).