Sturgeon Bay: Fire Incidents, Wisconsin (WI)
Where are fire incidents reported in Sturgeon Bay, WI
Something went wrong! Please refresh the page.
| Fire incidents reported | |
|---|---|
| Sreet name | Count |
| STATE HWY 57 | 54 |
| BAY SHORE DR | 44 |
| EGG HARBOR RD | 44 |
| 3RD AVE | 40 |
| MICHIGAN ST | 40 |
| STATE HWY 42 | 36 |
| DIVISION RD | 32 |
| 1ST AVE | 26 |
| CAVE POINT DR | 26 |
| NEENAH AVE | 26 |
| COUNTY C | 24 |
| GLIDDEN DR | 24 |
| MEMORIAL DR | 24 |
| 18TH AVE | 22 |
| GREEN BAY RD | 22 |
| MAPLE ST | 22 |
| 4TH AVE | 20 |
| MADISON AVE | 20 |
| MATHEY RD | 20 |
| OAK ST | 20 |
| WHITEFISH BAY RD | 20 |
| 7TH PL | 18 |
| DULUTH AVE | 18 |
| SHILOH RD | 18 |
| DUNN RD | 16 |
| RILEYS BAY RD | 16 |
| STATE HWY 42-57 | 16 |
| 8TH AVE | 14 |
| COUNTRY VIEW RD | 14 |
| COUNTY MM | 14 |
| Other | 211 |
2002 - 2018 National Fire Incident Reporting System (NFIRS) incidents
- Incident types reported to NFIRS in Sturgeon Bay, WI
- 5,43553.8%Rescue & EMS
- 2,60525.8%Hazardous Condition
- 9619.5%Fire
- 4324.3%False Alarm
- 3323.3%Service Call
- 2712.7%Good Intent Call
- 420.4%Special Incident
- 140.1%Overpressure Rupture
- Fire incident types reported to NFIRS in Sturgeon Bay, WI
- 42243.9%Structure Fires
- 30932.2%Outside Fires
- 15416.0%Mobile Property/Vehicle Fires
- 767.9%Other
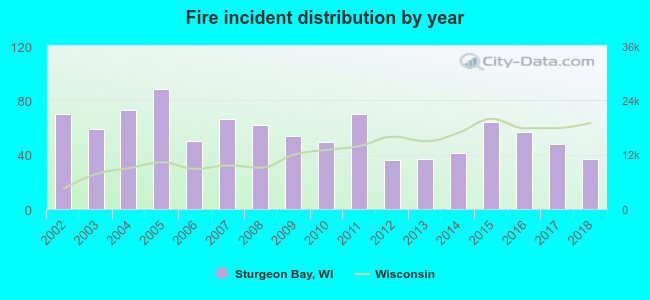 According to the data from the years 2002 - 2018 the average number of fire incidents per year is 57. The highest number of fire incidents - 88 took place in 2005, and the least - 36 in 2012. The data has a declining trend.
The average number of yearly fire incidents per 10k residents in Sturgeon Bay, WI compared to nearest cities:
(Note: Based on data for the last 3 years, including only cities with population 5,000 and above)
| Sturgeon Bay: | 52.3 |
| Marinette: | 42.2 |
| Suamico: | 9.5 |
| Green Bay: | 22.1 |
| Bellevue: | 27.8 |
| Howard: | 11.4 |
| Allouez: | 0.7 |
| Ledgeview: | 4.6 |
| Ashwaubenon: | 9.0 |
 The median response time based on all reported fire incidents is 6 minutes. This is about the same as the Wisconsin median value.
 29.9% incidents where reported in the morning and 70.1% in the evening. The most fires (16.4%) took place on Saturday, and the least (12.6%) on Wednesday.
 Based on the 961 incident reports from years 2002 - 2018 most fires (12.5%) took place during April, and the least (5.6%) in February.
 Out of all 10,099 cases reported during the years 2002 - 2018, the most belonged to the categories: Rescue & EMS (53.8%), Hazardous Condition (25.8%), and Fire (9.5%).
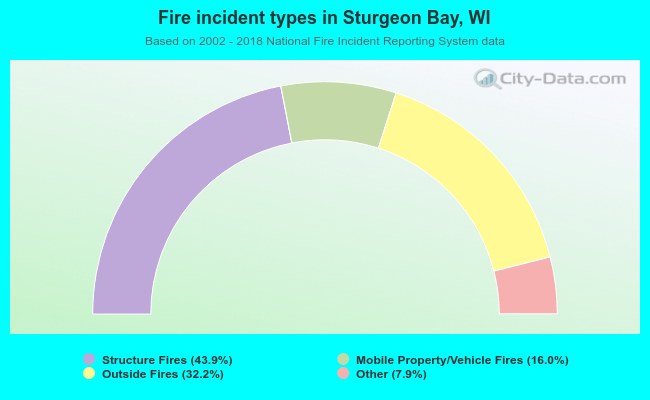 When looking into fire subcategories, the most incidents belonged to: Structure Fires (43.9%), and Outside Fires (32.2%).