Orangeburg: Fire Incidents, South Carolina (SC)
Where are fire incidents reported in Orangeburg, SC
Something went wrong! Please refresh the page.
| Fire incidents reported | |
|---|---|
| Sreet name | Count |
| NEESES HWY | 178 |
| MAGNOLIA ST | 176 |
| NORTH RD | 174 |
| INTERSTATE 26 EXPY | 160 |
| NORWAY RD | 156 |
| CHARLESTON HWY | 132 |
| CHESTNUT ST | 132 |
| FIVE CHOP RD | 128 |
| RUSSELL ST | 126 |
| ST MATTHEWS RD | 126 |
| COLUMBIA RD | 118 |
| BEASON RD | 114 |
| SHILLINGS BRIDGE RD | 114 |
| JOHN C CALHOUN DR | 108 |
| BROUGHTON ST | 98 |
| BILL SALLEY RD | 92 |
| BELLEVILLE RD | 86 |
| STILTON RD | 82 |
| BAMBERG RD | 76 |
| CANNON BRIDGE RD | 76 |
| KENNERLY RD | 76 |
| SLAB LANDING RD | 68 |
| ROWESVILLE RD | 66 |
| COLEMAN AVE | 64 |
| I-26 | 62 |
| ELLIS AVE | 60 |
| INTERSTATE 26 | 58 |
| OLD ELLOREE RD | 56 |
| OLD EDISTO DR | 54 |
| WHITTAKER PKY | 52 |
| Other | 2,502 |
2002 - 2018 National Fire Incident Reporting System (NFIRS) incidents
- Incident types reported to NFIRS in Orangeburg, SC
- 5,57039.8%Fire
- 3,04821.8%False Alarm
- 1,94413.9%Rescue & EMS
- 1,66111.9%Hazardous Condition
- 1,1948.5%Good Intent Call
- 3782.7%Service Call
- 1210.9%Severe Weather
- 670.5%Overpressure Rupture
- 170.1%Special Incident
- Fire incident types reported to NFIRS in Orangeburg, SC
- 2,18339.2%Structure Fires
- 2,02436.3%Outside Fires
- 1,06919.2%Mobile Property/Vehicle Fires
- 2945.3%Other
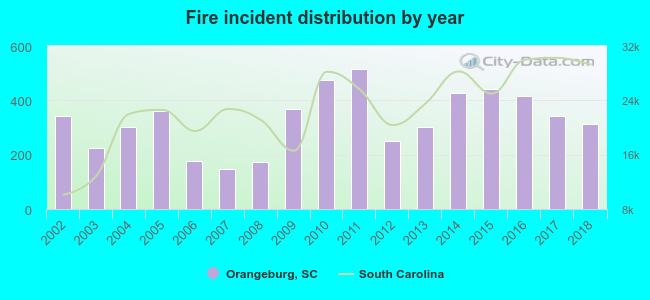 According to the data from the years 2002 - 2018 the average number of fires per year is 328. The highest number of fire incidents - 514 took place in 2011, and the least - 147 in 2007. The data has a decreasing trend.
The average number of yearly fire incidents per 10k residents in Orangeburg, SC compared to nearest cities:
(Note: Based on data for the last 3 years, including only cities with population 5,000 and above)
| Orangeburg: | 263.2 |
| Hopkins: | 127.9 |
| Cayce: | 59.5 |
| West Columbia: | 246.6 |
| Columbia: | 115.1 |
| Oak Grove: | 1.0 |
| Forest Acres: | 5.2 |
| Lexington: | 285.2 |
 The median response time based on all reported fire incidents is 5 minutes. This is lower than the state median value.
The median response time in Orangeburg, SC compared to nearest cities:
(Note: Based on data for all years, including only cities with at least 500 fire incidents)
| Orangeburg: | 5 minutes |
| Cordova: | 9 minutes |
| Cope: | 9 minutes |
| Bowman: | 11 minutes |
| Neeses: | 11 minutes |
| North: | 9 minutes |
| Bamberg: | 6 minutes |
| Elloree: | 11 minutes |
| Branchville: | 10 minutes |
 Based on the data from the years 2002 - 2018 the average number of fire-related yearly deaths is 1. The highest number of reported deaths - 3 took place in 2009, and the lowest - 0 in 2004. The data has a dropping trend.
The average number of deaths per 1,000 fire incidents is 2. This indicator was the highest - 8 in 2009, and the lowest 0 in 2004. The trend for deaths per 1,000 fires is declining. Compared to the South Carolina value the number of fatalities per 1,000 fires is similar.
Based on the data from the years 2002 - 2018 the average number of fire-related yearly deaths is 1. The highest number of reported deaths - 3 took place in 2009, and the lowest - 0 in 2004. The data has a dropping trend.
The average number of deaths per 1,000 fire incidents is 2. This indicator was the highest - 8 in 2009, and the lowest 0 in 2004. The trend for deaths per 1,000 fires is declining. Compared to the South Carolina value the number of fatalities per 1,000 fires is similar.Deaths per 1,000 incidents in Orangeburg, SC compared to nearest cities:
(Note: Based on data for all years, including only cities with at least 2,500 fire incidents)
| Orangeburg: | 2.0 |
| Gaston: | 3.1 |
| West Columbia: | 1.9 |
| Columbia: | 2.8 |
| Lexington: | 2.2 |
| Manning: | 0.0 |
 According to the data from the years 2002 - 2018 the average number of fire-related casualties per year is 2. The highest number of reported injuries - 14 took place in 2010, and the lowest - 0 in 2007. The data has an increasing trend.
The average number of injuries per 1,000 fire incidents is 7. This indicator was the highest - 29 in 2010, and the lowest 0 in 2007. The trend for casualties per 1,000 incidents is rising. Compared to the South Carolina value the number of injuries per 1,000 fires is similar.
According to the data from the years 2002 - 2018 the average number of fire-related casualties per year is 2. The highest number of reported injuries - 14 took place in 2010, and the lowest - 0 in 2007. The data has an increasing trend.
The average number of injuries per 1,000 fire incidents is 7. This indicator was the highest - 29 in 2010, and the lowest 0 in 2007. The trend for casualties per 1,000 incidents is rising. Compared to the South Carolina value the number of injuries per 1,000 fires is similar.
 29.2% incidents where reported in the morning and 70.8% in the evening. The most fires (15.0%) took place on Friday, and the least (13.7%) on Sunday.
 Based on the 5,570 fires from years 2002 - 2018 most fires (12.5%) took place during March, and the least (5.9%) in October.
 Out of all 14,000 cases reported during the years 2002 - 2018, the most belonged to the categories: Fire (39.8%), False Alarm (21.8%), and Rescue & EMS (13.9%).
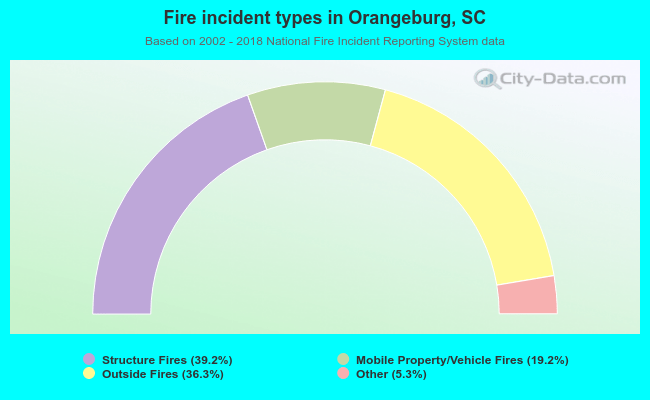 When looking into fire subcategories, the most incidents belonged to: Structure Fires (39.2%), and Outside Fires (36.3%).