Titusville: Fire Incidents, Florida (FL)
Where are fire incidents reported in Titusville, FL
Something went wrong! Please refresh the page.
| Fire incidents reported | |
|---|---|
| Sreet name | Count |
| WASHINGTON AVE | 434 |
| CHENEY HWY | 252 |
| GARDEN ST | 172 |
| PARK AVE | 170 |
| HOPKINS AVE | 146 |
| BARNA AVE | 142 |
| SOUTH ST | 130 |
| DELEON AVE | 88 |
| COLUMBIA BLVD | 76 |
| HARRISON ST | 76 |
| SINGLETON AVE | 64 |
| WINDOVER WAY | 56 |
| FOX LAKE RD | 54 |
| KNOX MCRAE DR | 50 |
| CARPENTER RD | 44 |
| INDIAN RIVER AVE | 40 |
| MAIN ST | 40 |
| PRAIRIE LN | 40 |
| TROPIC ST | 40 |
| ROCKPIT RD | 38 |
| SYCAMORE ST | 36 |
| TREE LN | 36 |
| I95 | 34 |
| PLANTATION DR | 34 |
| DIXIE AVE | 32 |
| I-95 I | 32 |
| COUNTRY CLUB DR | 30 |
| I 95 | 30 |
| WASHINGTON | 30 |
| WINDOVER OAKS CIR | 30 |
| Other | 631 |
2004 - 2018 National Fire Incident Reporting System (NFIRS) incidents
- Incident types reported to NFIRS in Titusville, FL
- 49,50776.4%Rescue & EMS
- 5,4398.4%Service Call
- 3,1074.8%Fire
- 3,0094.6%Good Intent Call
- 1,8822.9%Hazardous Condition
- 1,7352.7%False Alarm
- Fire incident types reported to NFIRS in Titusville, FL
- 1,65353.2%Outside Fires
- 82526.6%Structure Fires
- 55017.7%Mobile Property/Vehicle Fires
- 792.5%Other
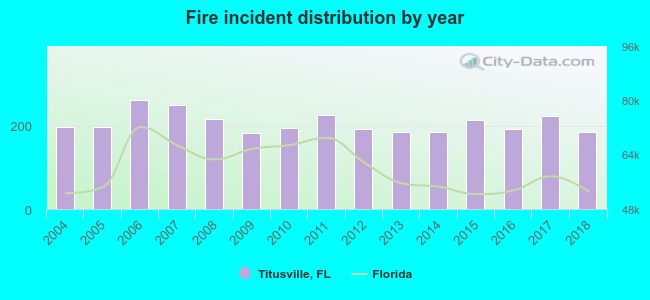 According to the data from the years 2004 - 2018 the average number of fires per year is 207. The highest number of fire incidents - 261 took place in 2006, and the least - 183 in 2009. The data has a decreasing trend.
The average number of yearly fire incidents per 10k residents in Titusville, FL compared to nearest cities:
(Note: Based on data for the last 3 years, including only cities with population 5,000 and above)
| Titusville: | 45.0 |
| Mims: | 93.0 |
| Cocoa: | 68.3 |
| Bithlo: | 2.0 |
| Merritt Island: | 26.7 |
| Rockledge: | 25.2 |
| Cape Canaveral: | 37.8 |
| Cocoa Beach: | 12.0 |
| Alafaya: | 0.2 |
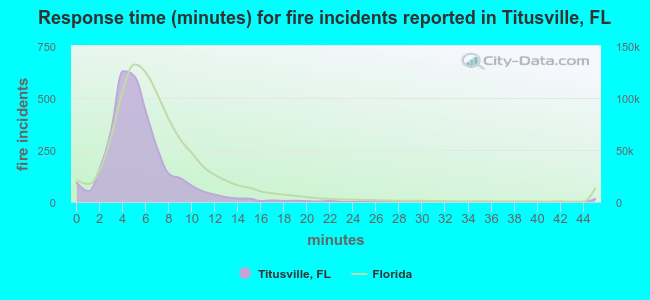 The median response time based on all reported fire incidents is 5 minutes. This is lower than the Florida median value.
The median response time in Titusville, FL compared to nearest cities:
(Note: Based on data for all years, including only cities with at least 500 fire incidents)
| Titusville: | 5 minutes |
| Mims: | 8 minutes |
| Cocoa: | 6 minutes |
| Merritt Island: | 7 minutes |
| Chuluota: | 6 minutes |
| Rockledge: | 5 minutes |
| Cape Canaveral: | 4 minutes |
| Geneva: | 8 minutes |
| Oviedo: | 6 minutes |
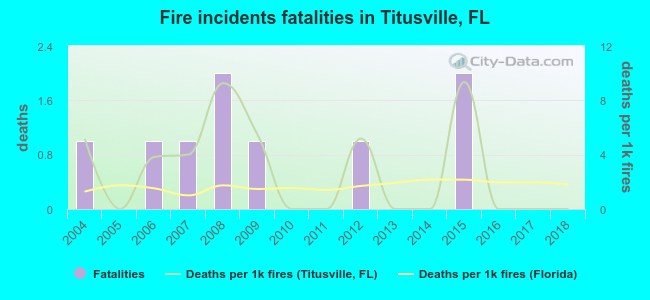 According to the reports from the years 2004 - 2018 the average number of fire-related yearly deaths is 1. The highest number of deaths - 2 took place in 2008, and the lowest - 0 in 2005. The data has a decreasing trend.
The average number of fatalities per 1,000 fires is 3. This indicator was the highest - 9 in 2015, and the lowest 0 in 2005. The trend for deaths per 1,000 fires is dropping. Compared to the Florida value the number of fatalities per 1,000 incidents is higher.
According to the reports from the years 2004 - 2018 the average number of fire-related yearly deaths is 1. The highest number of deaths - 2 took place in 2008, and the lowest - 0 in 2005. The data has a decreasing trend.
The average number of fatalities per 1,000 fires is 3. This indicator was the highest - 9 in 2015, and the lowest 0 in 2005. The trend for deaths per 1,000 fires is dropping. Compared to the Florida value the number of fatalities per 1,000 incidents is higher.
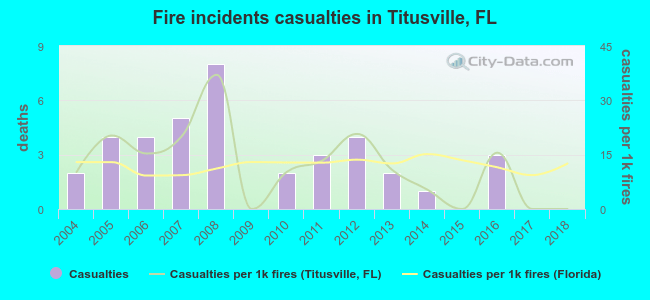 According to the reports from the years 2004 - 2018 the average number of fire-related casualties per year is 3. The highest number of casualties - 8 took place in 2008, and the lowest - 0 in 2009. The data has a dropping trend.
The average number of casualties per 1,000 fire incidents is 12. This indicator was the highest - 37 in 2008, and the lowest 0 in 2009. The trend for injuries per 1,000 fire incidents is declining. Compared to the Florida value the number of injuries per 1,000 fires is about the same.
According to the reports from the years 2004 - 2018 the average number of fire-related casualties per year is 3. The highest number of casualties - 8 took place in 2008, and the lowest - 0 in 2009. The data has a dropping trend.
The average number of casualties per 1,000 fire incidents is 12. This indicator was the highest - 37 in 2008, and the lowest 0 in 2009. The trend for injuries per 1,000 fire incidents is declining. Compared to the Florida value the number of injuries per 1,000 fires is about the same.Casualties per 1,000 incidents in Titusville, FL compared to nearest cities:
(Note: Based on data for all years, including only cities with at least 500 fire incidents)
| Titusville: | 12.2 |
| Mims: | 12.4 |
| Cocoa: | 6.0 |
| Merritt Island: | 10.1 |
| Chuluota: | 9.2 |
| Rockledge: | 18.6 |
| Cape Canaveral: | 4.9 |
| Geneva: | 20.3 |
| Oviedo: | 28.8 |
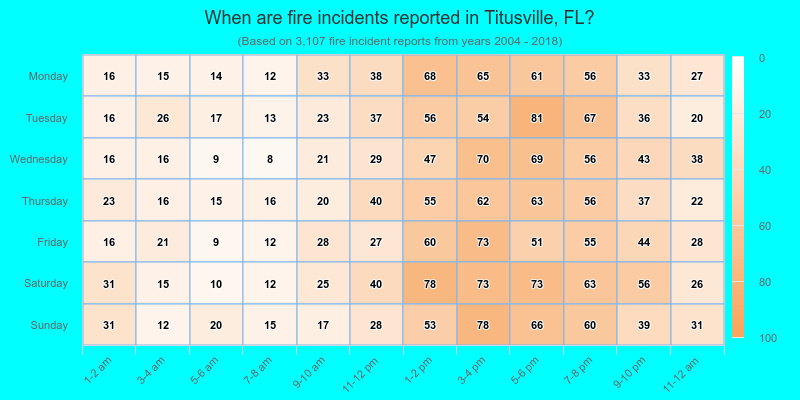
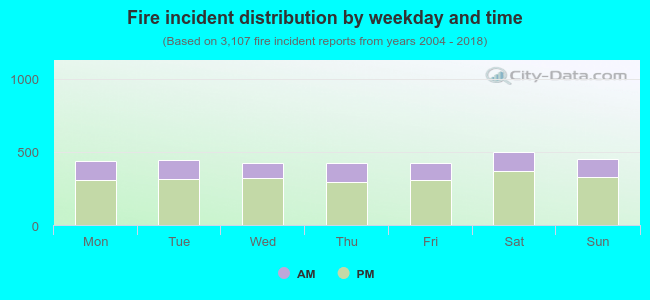 27.6% incidents where reported in the morning and 72.4% in the evening. The most fires (16.2%) took place on Saturday, and the least (13.6%) on Wednesday.
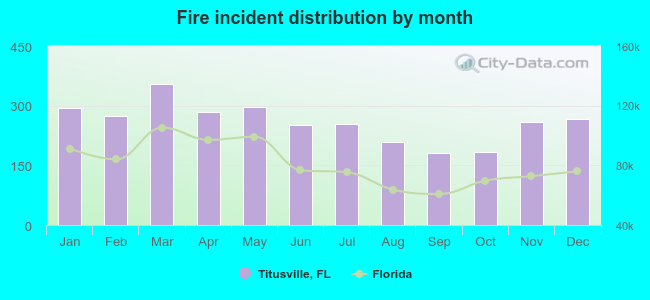 According to the 3,107 fire incident reports from years 2004 - 2018 most fires (11.4%) took place during March, and the least (5.8%) in September.
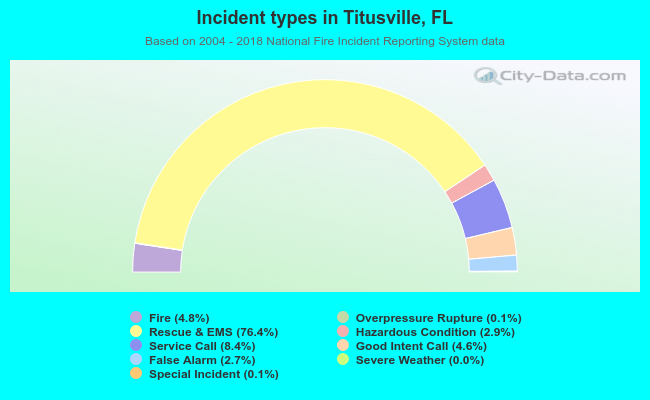 Out of all 64,785 cases reported during the years 2004 - 2018, the most belonged to the categories: Rescue & EMS (76.4%), Service Call (8.4%), and Fire (4.8%).
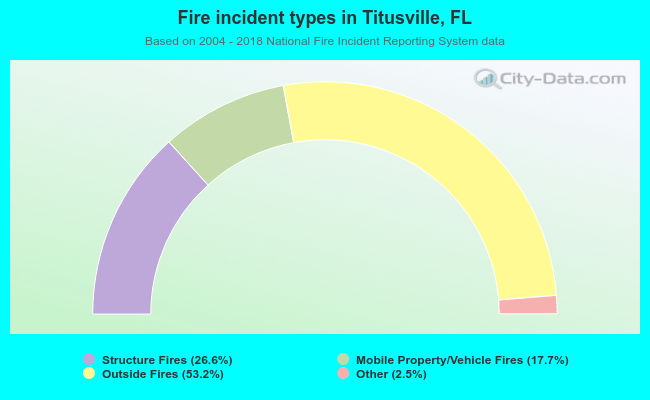 When looking into fire subcategories, the most incidents belonged to: Outside Fires (53.2%), and Structure Fires (26.6%).