Oviedo: Fire Incidents, Florida (FL)
Where are fire incidents reported in Oviedo, FL
Something went wrong! Please refresh the page.
| Fire incidents reported | |
|---|---|
| Sreet name | Count |
| ALAFAYA WOODS BLVD | 52 |
| S SR 417 | 40 |
| ALAFAYA WOODS BLVD | 30 |
| SR 426 | 30 |
| HOWARD AVE | 24 |
| N SR 417 | 24 |
| OVIEDO MARKETPLACE BLVD | 24 |
| W SR 426 | 24 |
| LOCKWOOD BLVD | 22 |
| ALAFAYA TRL | 20 |
| CHADDSFORD CIR | 20 |
| E MITCHELL HAMMOCK RD | 20 |
| FAWN RUN | 20 |
| BARR ST | 18 |
| LOCKWOOD BLVD | 18 |
| MITCHELL HAMMOCK RD | 18 |
| W BROADWAY ST | 18 |
| ALAFAYA TRL | 16 |
| EAST ST | 16 |
| ELM ST | 16 |
| FLORIDA AVE | 16 |
| RED BUG LAKE RD | 16 |
| RUNNING SPRINGS LOOP | 16 |
| STONE ST | 16 |
| BLACK HAMMOCK RD | 14 |
| GENEVA DR | 14 |
| GENOVA DR | 14 |
| N CR 426 | 14 |
| NORTHGATE CIR | 14 |
| ALAFAYA | 12 |
| Other | 1,258 |
2002 - 2017 National Fire Incident Reporting System (NFIRS) incidents
- Incident types reported to NFIRS in Oviedo, FL
- 12,12548.0%Rescue & EMS
- 3,61714.3%Service Call
- 3,08812.2%Good Intent Call
- 2,68310.6%Hazardous Condition
- 1,8747.4%Fire
- 1,3405.3%False Alarm
- 5132.0%Special Incident
- 320.1%Severe Weather
- Fire incident types reported to NFIRS in Oviedo, FL
- 80943.2%Outside Fires
- 72538.7%Structure Fires
- 28815.4%Mobile Property/Vehicle Fires
- 522.8%Other
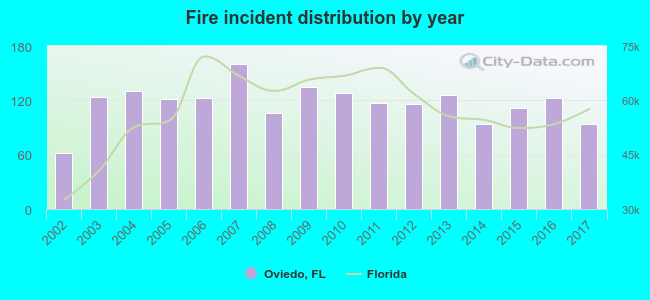 According to the data from the years 2002 - 2017 the average number of fire incidents per year is 117. The highest number of fires - 160 took place in 2007, and the least - 62 in 2002. The data has an increasing trend.
The average number of yearly fire incidents per 10k residents in Oviedo, FL compared to nearest cities:
(Note: Based on data for the last 3 years, including only cities with population 5,000 and above)
| Oviedo: | 19.3 |
| Winter Springs: | 11.3 |
| Casselberry: | 16.5 |
| Fern Park: | 13.8 |
| Bithlo: | 2.0 |
| Longwood: | 38.7 |
| Alafaya: | 0.2 |
| Winter Park: | 32.9 |
| Sanford: | 49.8 |
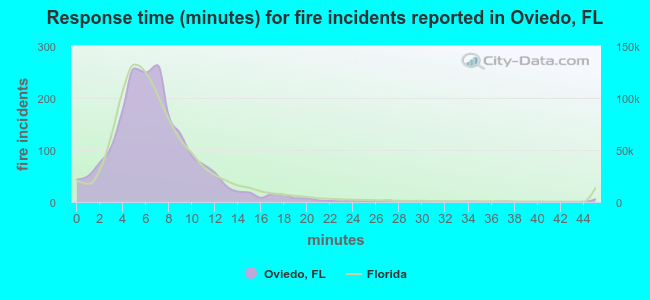 The median response time based on all reported fire incidents is 6 minutes. This is similar to the state median value.
The median response time in Oviedo, FL compared to nearest cities:
(Note: Based on data for all years, including only cities with at least 500 fire incidents)
| Oviedo: | 6 minutes |
| Chuluota: | 6 minutes |
| Winter Springs: | 5 minutes |
| Geneva: | 8 minutes |
| Casselberry: | 5 minutes |
| Longwood: | 5 minutes |
| Winter Park: | 6 minutes |
| Sanford: | 6 minutes |
| Lake Mary: | 6 minutes |
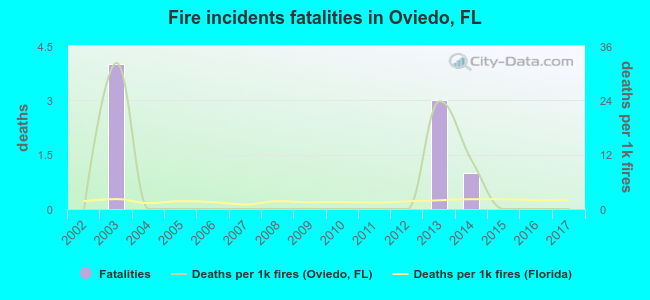 Based on the reports from the years 2002 - 2017 the average number of fire-related fatalities per year is 1. The highest number of reported deaths - 4 took place in 2003, and the lowest - 0 in 2002. The data has a constant trend.
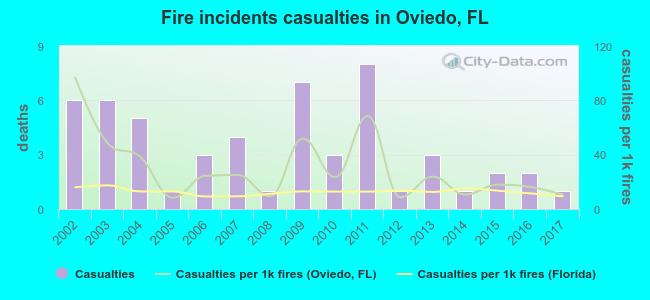 Based on the data from the years 2002 - 2017 the average number of fire-related yearly casualties is 3. The highest number of reported casualties - 8 took place in 2011, and the lowest - 1 in 2005. The data has a declining trend.
The average number of injuries per 1,000 fire incidents is 30. This indicator was the highest - 97 in 2002, and the lowest 8 in 2005. The trend for casualties per 1,000 incidents is decreasing. Compared to the Florida value the number of injuries per 1,000 incidents is much higher.
Based on the data from the years 2002 - 2017 the average number of fire-related yearly casualties is 3. The highest number of reported casualties - 8 took place in 2011, and the lowest - 1 in 2005. The data has a declining trend.
The average number of injuries per 1,000 fire incidents is 30. This indicator was the highest - 97 in 2002, and the lowest 8 in 2005. The trend for casualties per 1,000 incidents is decreasing. Compared to the Florida value the number of injuries per 1,000 incidents is much higher.Casualties per 1,000 incidents in Oviedo, FL compared to nearest cities:
(Note: Based on data for all years, including only cities with at least 500 fire incidents)
| Oviedo: | 28.8 |
| Chuluota: | 9.2 |
| Winter Springs: | 36.7 |
| Geneva: | 20.3 |
| Casselberry: | 20.4 |
| Longwood: | 29.7 |
| Winter Park: | 24.3 |
| Sanford: | 13.4 |
| Lake Mary: | 20.7 |
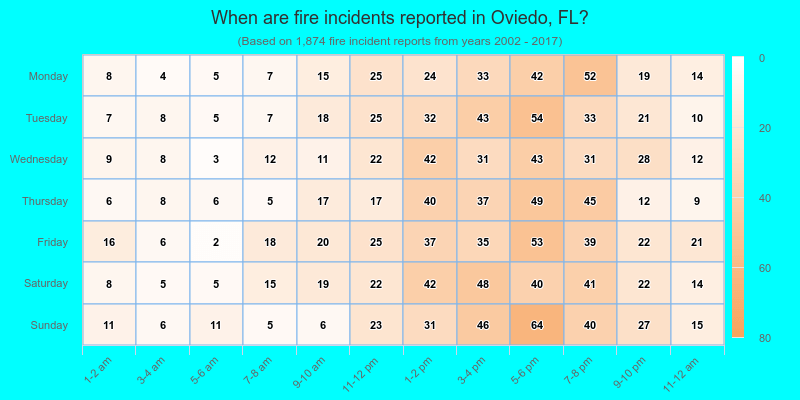
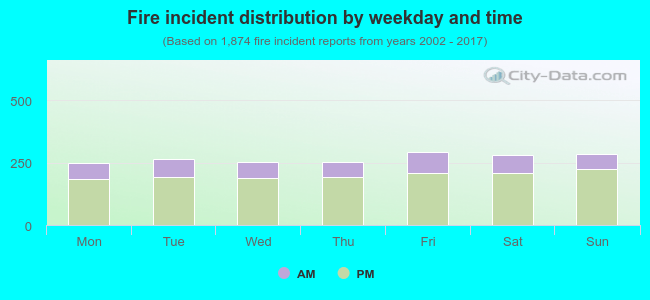 25.7% incidents where reported in the morning and 74.3% in the evening. The most fires (15.7%) took place on Friday, and the least (13.2%) on Monday.
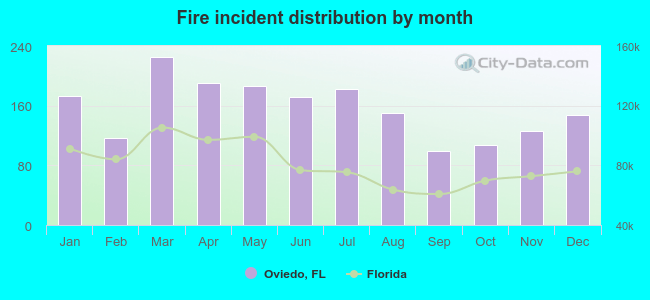 Based on the 1,874 fire incidents from years 2002 - 2017 most fires (12.0%) took place during March, and the least (5.3%) in September.
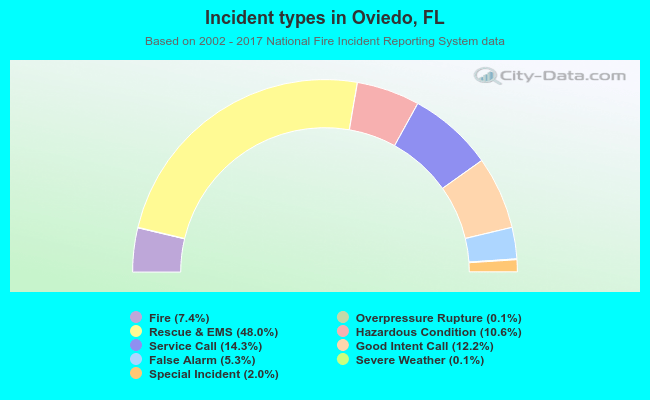 Out of all 25,285 cases reported during the years 2002 - 2017, the most belonged to the categories: Rescue & EMS (48.0%), Service Call (14.3%), and Good Intent Call (12.2%).
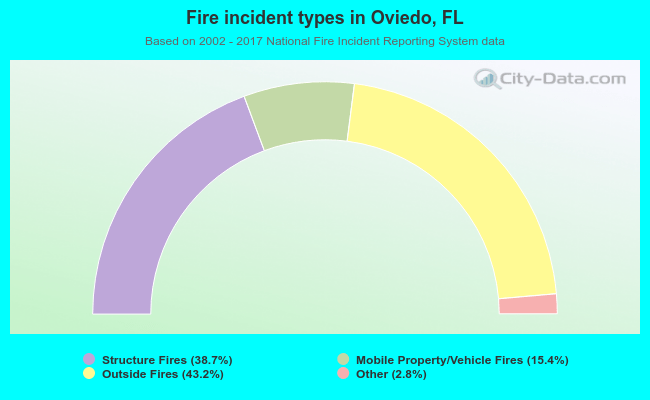 When looking into fire subcategories, the most reports belonged to: Outside Fires (43.2%), and Structure Fires (38.7%).