Tonkawa: Fire Incidents, Oklahoma (OK)
Where are fire incidents reported in Tonkawa, OK
Something went wrong! Please refresh the page.
|
| |||||||||||||||||||||||||||||||||||||||||||||||||||||||||||||||||||||||||||||||||||||||||||||||||||||||||||||
| Other | 313 | |||||||||||||||||||||||||||||||||||||||||||||||||||||||||||||||||||||||||||||||||||||||||||||||||||||||||||||
2003 - 2018 National Fire Incident Reporting System (NFIRS) incidents
- Incident types reported to NFIRS in Tonkawa, OK
- 58338.4%Fire
- 38425.3%Service Call
- 17511.5%Hazardous Condition
- 17211.3%Good Intent Call
- 1348.8%Rescue & EMS
- 573.8%False Alarm
- 110.7%Special Incident
- 40.3%Overpressure Rupture
- Fire incident types reported to NFIRS in Tonkawa, OK
- 38666.2%Outside Fires
- 8614.8%Structure Fires
- 8514.6%Mobile Property/Vehicle Fires
- 264.5%Other
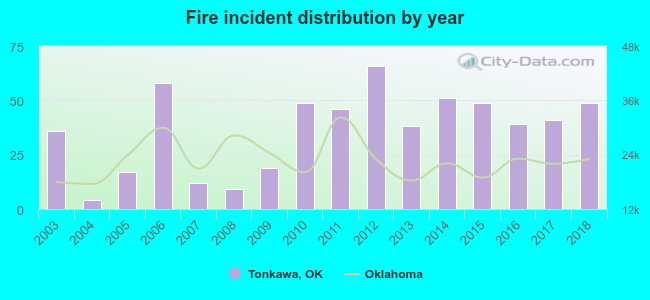 Based on the data from the years 2003 - 2018 the average number of fire incidents per year is 36. The highest number of reported fires - 66 took place in 2012, and the least - 4 in 2004. The data has a rising trend.
 The median response time based on all reported fire incidents is 5 minutes. This is lower than the state median value.
The median response time in Tonkawa, OK compared to nearest cities:
(Note: Based on data for all years, including only cities with at least 500 fire incidents)
| Tonkawa: | 5 minutes |
| Blackwell: | 5 minutes |
| Ponca City: | 5 minutes |
| Perry: | 8 minutes |
| Arkansas City: | 7 minutes |
| Enid: | 4 minutes |
| Wellington: | 7 minutes |
| Stillwater: | 8 minutes |
| Winfield: | 8 minutes |
 29.2% incidents where reported in the morning and 70.8% in the evening. The most fires (15.8%) took place on Monday, and the least (10.6%) on Thursday.
 Based on the 583 fire incidents from years 2003 - 2018 most fires (14.1%) took place during March, and the least (4.6%) in November.
 Out of all 1,520 cases reported during the years 2003 - 2018, the most belonged to the categories: Fire (38.4%), Service Call (25.3%), and Hazardous Condition (11.5%).
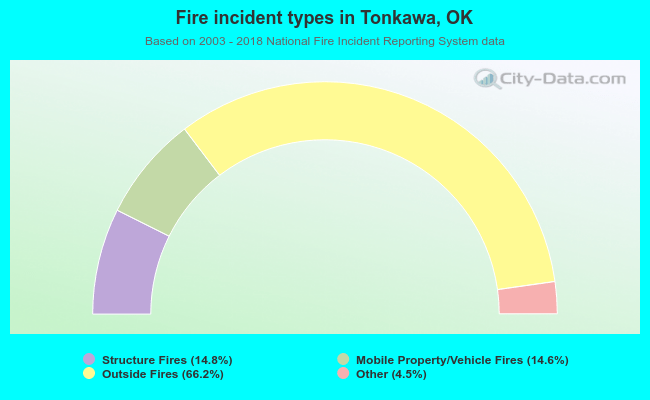 When looking into fire subcategories, the most incidents belonged to: Outside Fires (66.2%), and Structure Fires (14.8%).