Troy: Fire Incidents, North Carolina (NC)
Where are fire incidents reported in Troy, NC
Something went wrong! Please refresh the page.
|
| |||||||||||||||||||||||||||||||||||||||||||||||||||||||||||||||||||||||||||||||||||||||||||||||||||||||||||||
2002 - 2018 National Fire Incident Reporting System (NFIRS) incidents
- Incident types reported to NFIRS in Troy, NC
- 1,01150.7%Hazardous Condition
- 50025.1%Fire
- 20210.1%False Alarm
- 1417.1%Good Intent Call
- 894.5%Rescue & EMS
- 371.9%Service Call
- 100.5%Severe Weather
- 30.2%Special Incident
- Fire incident types reported to NFIRS in Troy, NC
- 21943.8%Outside Fires
- 15731.4%Structure Fires
- 7014.0%Other
- 5410.8%Mobile Property/Vehicle Fires
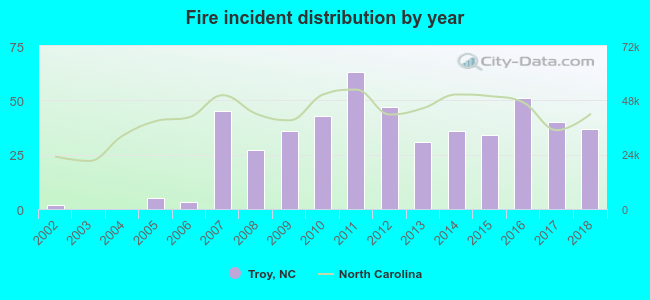 According to the data from the years 2002 - 2018 the average number of fire incidents per year is 29. The highest number of reported fire incidents - 63 took place in 2011, and the least - 0 in 2003. The data has an increasing trend.
 The median response time based on all reported fire incidents is 7 minutes. This is similar to the North Carolina median value.
The median response time in Troy, NC compared to nearest cities:
(Note: Based on data for all years, including only cities with at least 500 fire incidents)
| Troy: | 7 minutes |
| Seagrove: | 10 minutes |
| Albemarle: | 6 minutes |
| Robbins: | 9 minutes |
| Denton: | 8 minutes |
| Asheboro: | 6 minutes |
| Pinehurst: | 6 minutes |
| Carthage: | 9 minutes |
| Wadesboro: | 5 minutes |
 33.0% incidents where reported in the morning and 67.0% in the evening. The most fires (17.4%) took place on Friday, and the least (11.6%) on Wednesday.
 Based on the 500 fires from years 2002 - 2018 most fires (12.2%) took place during April, and the least (5.0%) in July.
 Out of all 1,993 cases reported during the years 2002 - 2018, the most belonged to the categories: Rescue & EMS (50.7%), Fire (25.1%), and Good Intent Call (10.1%).
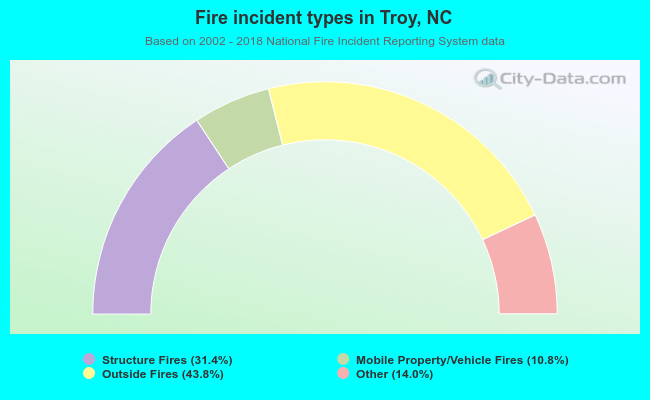 When looking into fire subcategories, the most incidents belonged to: Outside Fires (43.8%), and Structure Fires (31.4%).