Tuscaloosa: Fire Incidents, Alabama (AL)
Where are fire incidents reported in Tuscaloosa, AL
Something went wrong! Please refresh the page.
| Fire incidents reported | |
|---|---|
| Sreet name | Count |
| HARGROVE RD | 902 |
| UNIVERSITY BLVD | 633 |
| 15TH ST | 587 |
| MCFARLAND BL | 535 |
| MCFARLAND BLVD | 534 |
| HACKBERRY LN | 488 |
| 21ST ST | 465 |
| CULVER RD | 456 |
| SKYLAND BLVD | 435 |
| UNIVERSITY BL | 435 |
| 10TH AVE | 429 |
| RICE MINE RD | 426 |
| SKYLAND BL | 420 |
| I59 | 413 |
| GREENSBORO AVE | 336 |
| 37TH ST | 331 |
| 17TH ST | 330 |
| OLD GREENSBORO RD | 328 |
| 18TH ST | 321 |
| CYPRESS CREEK AVE | 295 |
| CRESCENT RIDGE RD | 285 |
| GREENSBORO AV | 255 |
| 25TH ST | 249 |
| PAUL W BRYANT DR | 247 |
| 48TH ST | 244 |
| 20TH ST | 243 |
| RICE VALLEY RD | 242 |
| 13TH ST | 238 |
| 19TH ST | 237 |
| 8TH ST | 236 |
2003 - 2017 National Fire Incident Reporting System (NFIRS) incidents
- Incident types reported to NFIRS in Tuscaloosa, AL
- 27,54956.8%Rescue & EMS
- 9,43119.4%Fire
- 3,8858.0%False Alarm
- 2,5305.2%Hazardous Condition
- 2,5265.2%Service Call
- 2,4575.1%Good Intent Call
- 740.2%Overpressure Rupture
- Fire incident types reported to NFIRS in Tuscaloosa, AL
- 3,60038.2%Structure Fires
- 3,52537.4%Outside Fires
- 1,77118.8%Mobile Property/Vehicle Fires
- 5355.7%Other
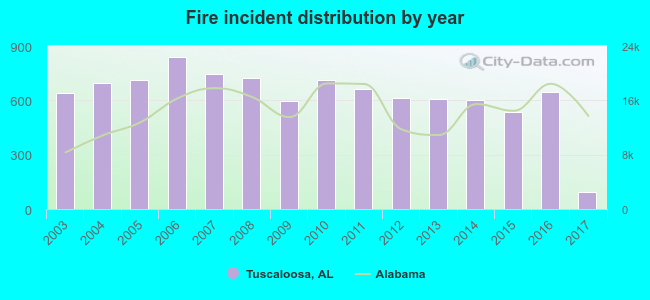 Based on the data from the years 2003 - 2017 the average number of fire incidents per year is 628. The highest number of reported fire incidents - 839 took place in 2006, and the least - 94 in 2017. The data has a decreasing trend.
The average number of yearly fire incidents per 10k residents in Tuscaloosa, AL compared to nearest cities:
(Note: Based on data for the last 3 years, including only cities with population 5,000 and above)
| Tuscaloosa: | 25.9 |
| Northport: | 46.5 |
| Abernant: | 1.3 |
| Hueytown: | 27.8 |
| Bessemer: | 92.8 |
| Pleasant Grove: | 30.3 |
| Midfield: | 63.3 |
| Montevallo: | 41.9 |
| Helena: | 3.4 |
 The median response time based on all reported fire incidents is 5 minutes. This is lower than the state median value.
The median response time in Tuscaloosa, AL compared to nearest cities:
(Note: Based on data for all years, including only cities with at least 500 fire incidents)
| Tuscaloosa: | 5 minutes |
| Northport: | 5 minutes |
| Bessemer: | 5 minutes |
| Fayette: | 6 minutes |
| Pleasant Grove: | 4 minutes |
| Midfield: | 5 minutes |
| Parrish: | 10 minutes |
| Alabaster: | 6 minutes |
| Adamsville: | 5 minutes |
 According to the data from the years 2003 - 2017 the average number of fire-related fatalities per year is 2. The highest number of reported deaths - 5 took place in 2006, and the lowest - 0 in 2009. The data has a decreasing trend.
The average number of deaths per 1,000 fires is 2. This indicator was the highest - 7 in 2010, and the lowest 0 in 2009. The trend for deaths per 1,000 fire incidents is dropping. Compared to the Alabama value the number of fatalities per 1,000 incidents is similar.
According to the data from the years 2003 - 2017 the average number of fire-related fatalities per year is 2. The highest number of reported deaths - 5 took place in 2006, and the lowest - 0 in 2009. The data has a decreasing trend.
The average number of deaths per 1,000 fires is 2. This indicator was the highest - 7 in 2010, and the lowest 0 in 2009. The trend for deaths per 1,000 fire incidents is dropping. Compared to the Alabama value the number of fatalities per 1,000 incidents is similar.Deaths per 1,000 incidents in Tuscaloosa, AL compared to nearest cities:
(Note: Based on data for all years, including only cities with at least 2,500 fire incidents)
| Tuscaloosa: | 2.4 |
| Bessemer: | 2.0 |
 Based on the reports from the years 2003 - 2017 the average number of fire-related casualties per year is 8. The highest number of reported injuries - 14 took place in 2004, and the lowest - 0 in 2017. The data has a dropping trend.
The average number of injuries per 1,000 fire incidents is 12. This indicator was the highest - 21 in 2012, and the lowest 0 in 2017. The trend for injuries per 1,000 incidents is dropping. Compared to the state value the number of casualties per 1,000 fires is much higher.
Based on the reports from the years 2003 - 2017 the average number of fire-related casualties per year is 8. The highest number of reported injuries - 14 took place in 2004, and the lowest - 0 in 2017. The data has a dropping trend.
The average number of injuries per 1,000 fire incidents is 12. This indicator was the highest - 21 in 2012, and the lowest 0 in 2017. The trend for injuries per 1,000 incidents is dropping. Compared to the state value the number of casualties per 1,000 fires is much higher.Casualties per 1,000 incidents in Tuscaloosa, AL compared to nearest cities:
(Note: Based on data for all years, including only cities with at least 500 fire incidents)
| Tuscaloosa: | 12.5 |
| Northport: | 7.0 |
| Bessemer: | 5.0 |
| Fayette: | 1.3 |
| Pleasant Grove: | 5.3 |
| Midfield: | 0.0 |
| Parrish: | 2.9 |
| Alabaster: | 14.4 |
| Adamsville: | 15.6 |
 34.8% incidents where reported in the morning and 65.2% in the evening. The most fires (16.0%) took place on Saturday, and the least (13.1%) on Wednesday.
 Based on the 9,431 fire incidents from years 2003 - 2017 most fires (9.7%) took place during January, and the least (7.3%) in August.
 Out of all 48,521 cases reported during the years 2003 - 2017, the most belonged to the categories: Rescue & EMS (56.8%), Fire (19.4%), and False Alarm (8.0%).
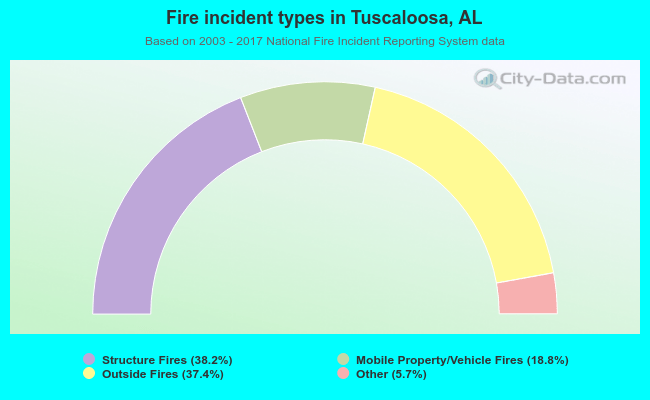 When looking into fire subcategories, the most reports belonged to: Structure Fires (38.2%), and Outside Fires (37.4%).