Walworth: Fire Incidents, New York (NY)
Where are fire incidents reported in Walworth, NY
Something went wrong! Please refresh the page.
|
| |||||||||||||||||||||||||||||||||||||||||||||||||||||||||||||||||||||||||||||||||||||||||||||||||||||||||||||
2002 - 2018 National Fire Incident Reporting System (NFIRS) incidents
- Incident types reported to NFIRS in Walworth, NY
- 34235.8%Hazardous Condition
- 15516.2%Rescue & EMS
- 14214.9%Fire
- 13313.9%Good Intent Call
- 10110.6%Service Call
- 606.3%False Alarm
- 131.4%Special Incident
- 80.8%Severe Weather
- 10.1%Overpressure Rupture
- Fire incident types reported to NFIRS in Walworth, NY
- 10372.5%Structure Fires
- 2819.7%Outside Fires
- 74.9%Other
- 42.8%Mobile Property/Vehicle Fires
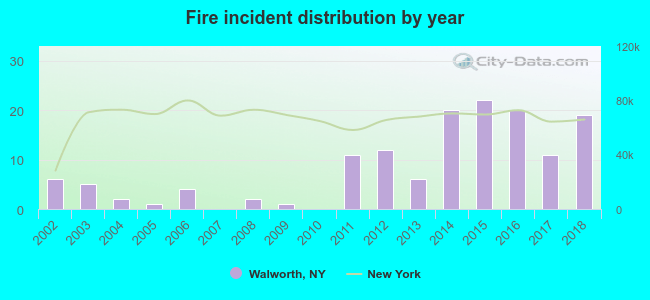 According to the data from the years 2002 - 2018 the average number of fires per year is 8. The highest number of reported fire incidents - 22 took place in 2015, and the least - 0 in 2007. The data has a growing trend.
The average number of yearly fire incidents per 10k residents in Walworth, NY compared to nearest cities:
(Note: Based on data for the last 3 years, including only cities with population 5,000 and above)
| Walworth: | 17.6 |
| Ontario: | 27.3 |
| Webster: | 200.8 |
| Fairport: | 126.0 |
| Penfield: | 21.2 |
| Perinton: | 2.3 |
| Williamson: | 27.7 |
| East Rochester: | 31.3 |
| Farmington: | 38.3 |
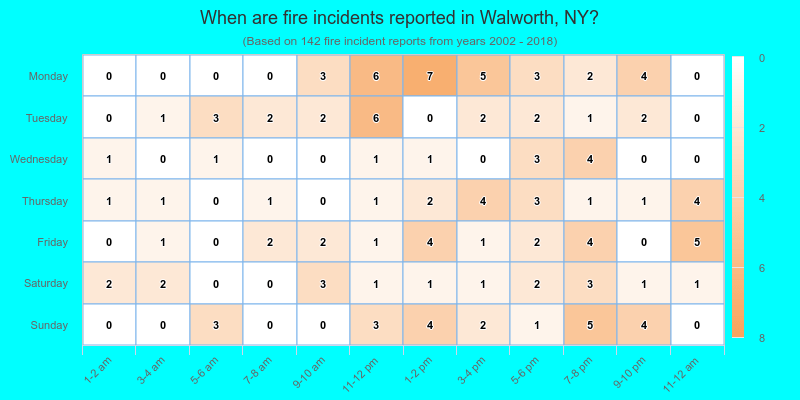
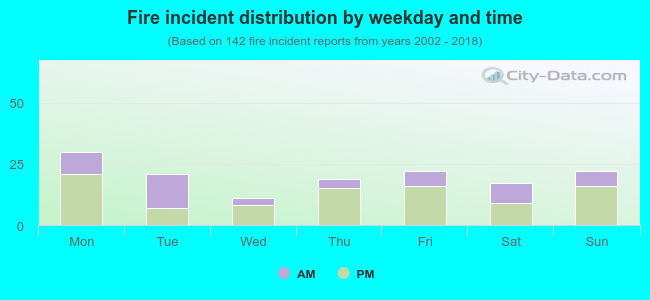 35.2% incidents where reported in the morning and 64.8% in the evening. The most fires (21.1%) took place on Monday, and the least (7.7%) on Wednesday.
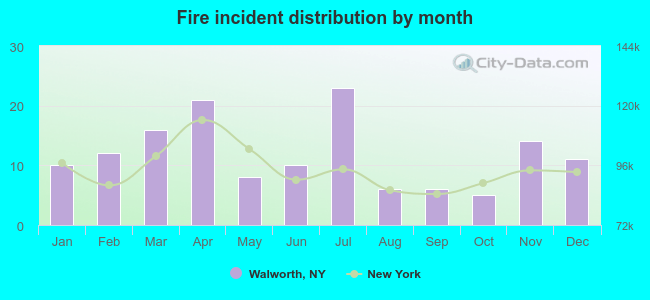 According to the 142 reports from years 2002 - 2018 most fires (16.2%) took place during July, and the least (3.5%) in October.
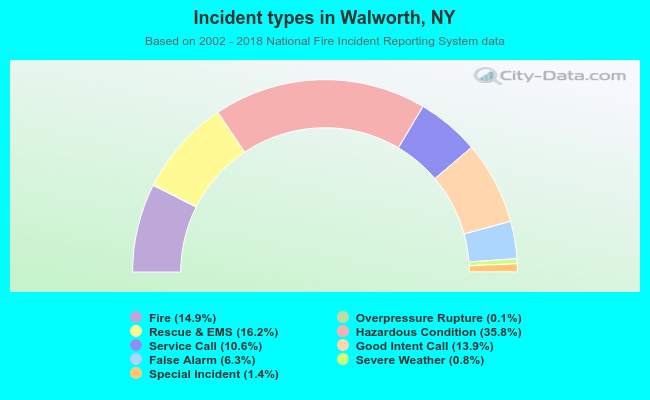 Out of all 955 cases reported during the years 2002 - 2018, the most belonged to the categories: Hazardous Condition (35.8%), Rescue & EMS (16.2%), and Fire (14.9%).
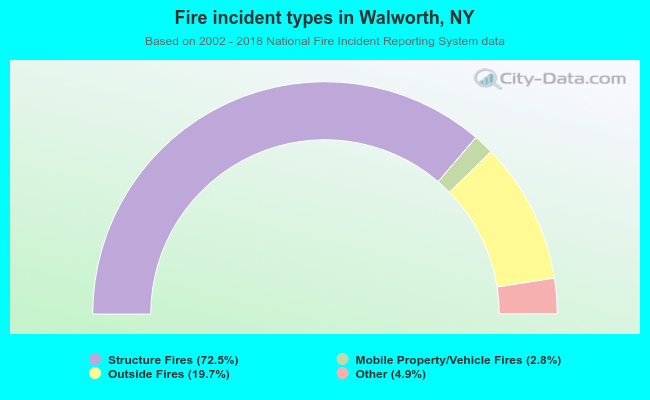 When looking into fire subcategories, the most reports belonged to: Structure Fires (72.5%), and Outside Fires (19.7%).