East Rochester: Fire Incidents, New York (NY)
Where are fire incidents reported in East Rochester, NY
Something went wrong! Please refresh the page.
|
| |||||||||||||||||||||||||||||||||||||||||||||||||||||||||||||||||||||||||||||||||||||||||||||||||||||||||||||
2002 - 2018 National Fire Incident Reporting System (NFIRS) incidents
- Incident types reported to NFIRS in East Rochester, NY
- 2,31151.8%Hazardous Condition
- 51511.6%Rescue & EMS
- 47110.6%False Alarm
- 45810.3%Fire
- 4369.8%Service Call
- 2415.4%Good Intent Call
- 130.3%Overpressure Rupture
- 120.3%Severe Weather
- Fire incident types reported to NFIRS in East Rochester, NY
- 20645.0%Structure Fires
- 15333.4%Outside Fires
- 6213.5%Mobile Property/Vehicle Fires
- 378.1%Other
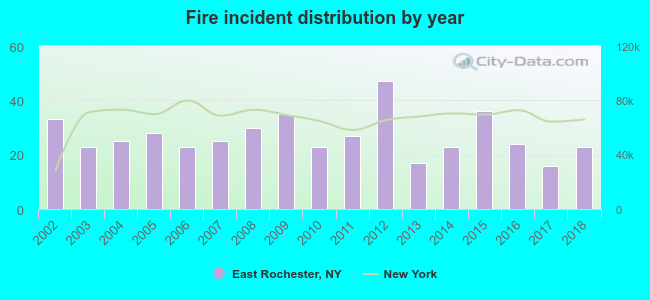 According to the data from the years 2002 - 2018 the average number of fire incidents per year is 27. The highest number of reported fires - 47 took place in 2012, and the least - 16 in 2017. The data has a dropping trend.
The average number of yearly fire incidents per 10k residents in East Rochester, NY compared to nearest cities:
(Note: Based on data for the last 3 years, including only cities with population 5,000 and above)
| East Rochester: | 31.3 |
| Fairport: | 126.0 |
| Perinton: | 2.3 |
| Penfield: | 21.2 |
| Brighton: | 1.6 |
| Rochester: | 93.1 |
| Webster: | 200.8 |
| Henrietta: | 7.2 |
| Irondequoit: | 10.0 |
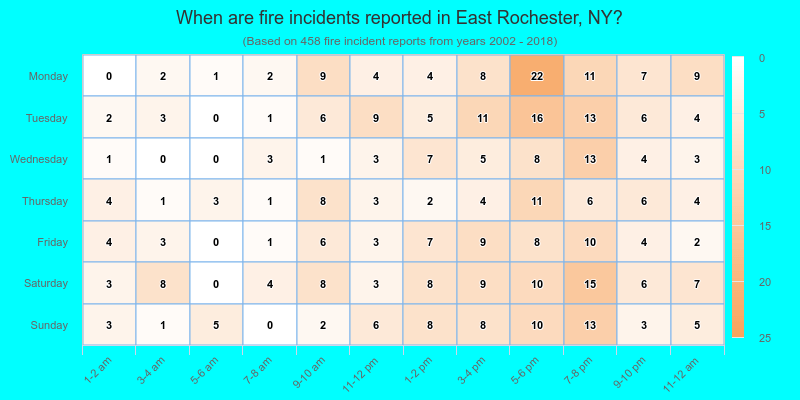
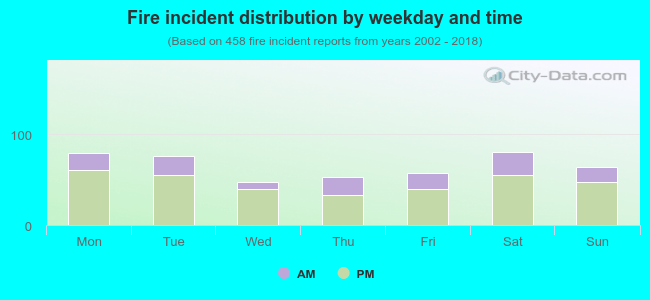 27.7% incidents where reported in the morning and 72.3% in the evening. The most fires (17.7%) took place on Saturday, and the least (10.5%) on Wednesday.
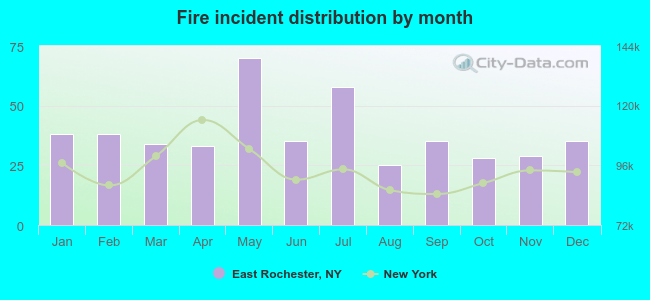 According to the 458 incident reports from years 2002 - 2018 most fires (15.3%) took place during May, and the least (5.5%) in August.
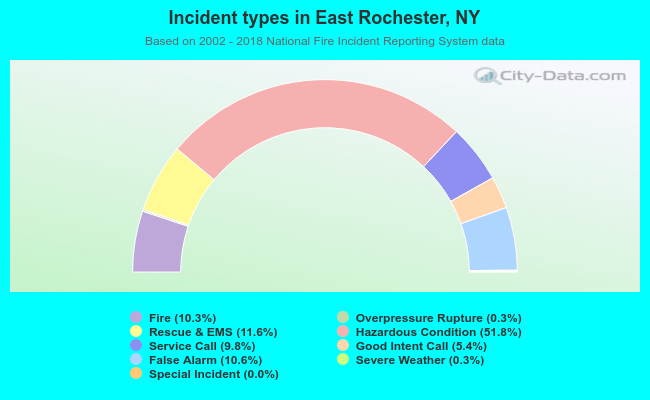 Out of all 4,458 cases reported during the years 2002 - 2018, the most belonged to the categories: Hazardous Condition (51.8%), Rescue & EMS (11.6%), and False Alarm (10.6%).
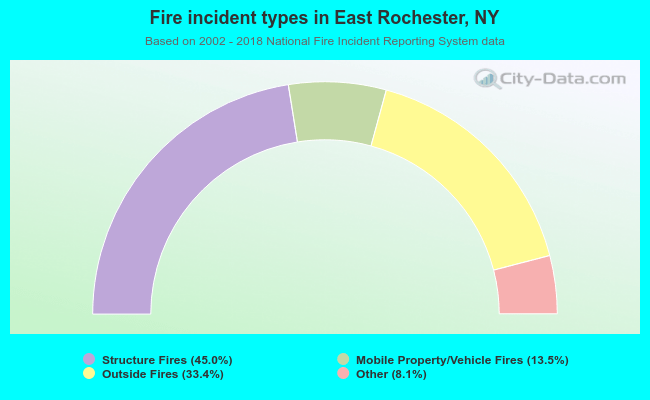 When looking into fire subcategories, the most incidents belonged to: Structure Fires (45.0%), and Outside Fires (33.4%).