Waterloo: Fire Incidents, Iowa (IA)
Where are fire incidents reported in Waterloo, IA
Something went wrong! Please refresh the page.
| Fire incidents reported | |
|---|---|
| Sreet name | Count |
| 4TH ST | 150 |
| LAFAYETTE ST | 86 |
| 5TH ST | 68 |
| COMMERCIAL ST | 60 |
| 9TH ST | 56 |
| FRANKLIN ST | 48 |
| DONALD ST | 46 |
| SYCAMORE ST | 46 |
| 3RD ST | 44 |
| RIDGEWAY | 40 |
| AIRLINE HWY | 38 |
| RANDOLPH ST | 38 |
| LOGAN AV | 34 |
| MULBERRY ST | 34 |
| 11TH ST | 32 |
| INDEPENDENCE AV | 32 |
| RIDGEWAY AV | 32 |
| ANSBOROUGH AV | 30 |
| BALTIMORE ST | 30 |
| FLAMMANG DR | 30 |
| INDEPENDENCE AVE | 30 |
| LA PORTE RD | 30 |
| NEWELL ST | 30 |
| 2ND ST | 28 |
| DAWSON ST | 28 |
| ELK RUN RD | 28 |
| LOGAN | 28 |
| 6TH ST | 26 |
| BROADWAY ST | 26 |
| COLUMBIA ST | 26 |
| Other | 883 |
2002 - 2018 National Fire Incident Reporting System (NFIRS) incidents
- Incident types reported to NFIRS in Waterloo, IA
- 10,39049.1%Rescue & EMS
- 3,00314.2%Service Call
- 2,16310.2%Hazardous Condition
- 2,13710.1%Fire
- 2,0299.6%False Alarm
- 1,1465.4%Good Intent Call
- 2341.1%Special Incident
- 500.2%Overpressure Rupture
- Fire incident types reported to NFIRS in Waterloo, IA
- 87641.0%Structure Fires
- 70833.1%Outside Fires
- 44921.0%Mobile Property/Vehicle Fires
- 1044.9%Other
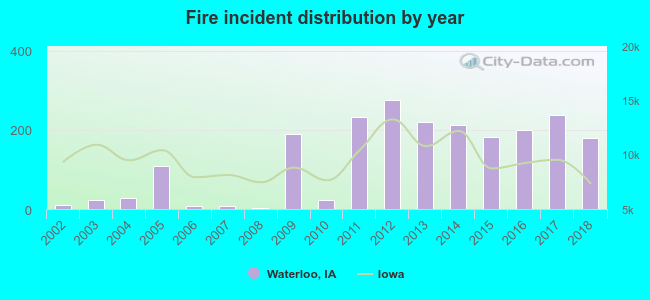 According to the data from the years 2002 - 2018 the average number of fire incidents per year is 126. The highest number of reported fire incidents - 275 took place in 2012, and the least - 2 in 2008. The data has a growing trend.
The average number of yearly fire incidents per 10k residents in Waterloo, IA compared to nearest cities:
(Note: Based on data for the last 3 years, including only cities with population 5,000 and above)
| Waterloo: | 30.0 |
| Cedar Falls: | 6.9 |
| Waverly: | 4.0 |
| Independence: | 18.9 |
| Oelwein: | 54.2 |
| Vinton: | 29.1 |
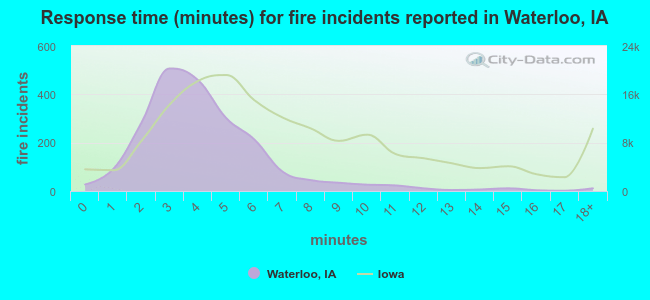 The median response time based on all reported fire incidents is 4 minutes. This is lower compared to the state median value.
The median response time in Waterloo, IA compared to nearest cities:
(Note: Based on data for all years, including only cities with at least 500 fire incidents)
| Waterloo: | 4 minutes |
| Cedar Falls: | 5 minutes |
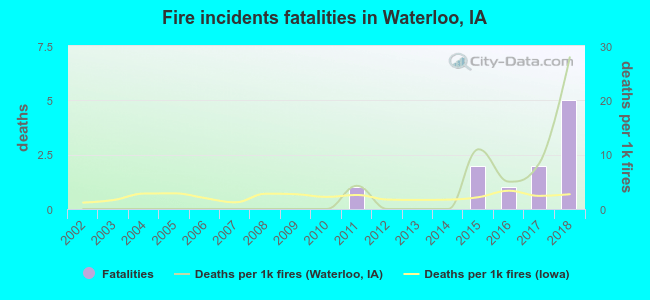 Based on the reports from the years 2002 - 2018 the average number of fire-related yearly deaths is 1. The highest number of reported deaths - 5 took place in 2018, and the lowest - 0 in 2002. The data has an increasing trend.
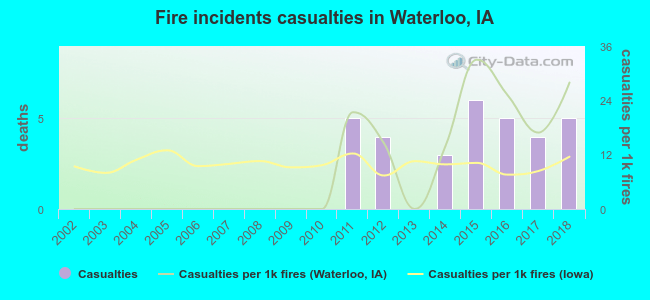 Based on the data from the years 2002 - 2018 the average number of fire-related casualties per year is 2. The highest number of reported injuries - 6 took place in 2015, and the lowest - 0 in 2002. The data has a rising trend.
The average number of injuries per 1,000 fire incidents is 9. This indicator was the highest - 33 in 2015, and the lowest 0 in 2002. The trend for casualties per 1,000 fire incidents is rising. Compared to the state value the number of casualties per 1,000 fire incidents is higher.
Based on the data from the years 2002 - 2018 the average number of fire-related casualties per year is 2. The highest number of reported injuries - 6 took place in 2015, and the lowest - 0 in 2002. The data has a rising trend.
The average number of injuries per 1,000 fire incidents is 9. This indicator was the highest - 33 in 2015, and the lowest 0 in 2002. The trend for casualties per 1,000 fire incidents is rising. Compared to the state value the number of casualties per 1,000 fire incidents is higher.Casualties per 1,000 incidents in Waterloo, IA compared to nearest cities:
(Note: Based on data for all years, including only cities with at least 500 fire incidents)
| Waterloo: | 15.0 |
| Cedar Falls: | 8.1 |
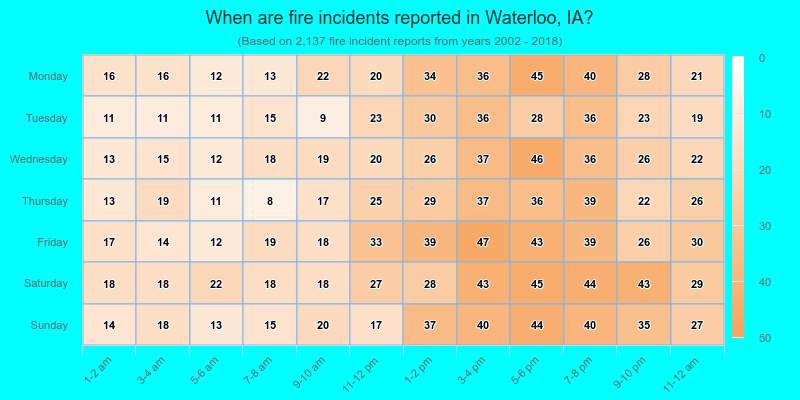
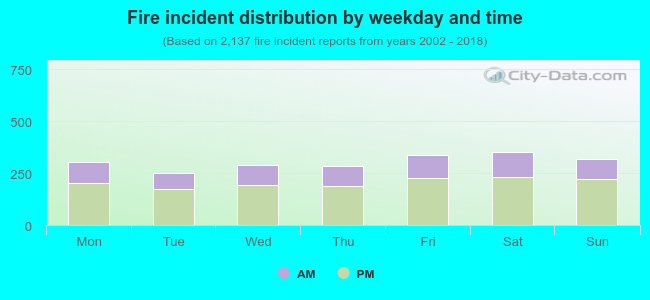 32.8% incidents where reported in the morning and 67.2% in the evening. The most fires (16.5%) took place on Saturday, and the least (11.8%) on Tuesday.
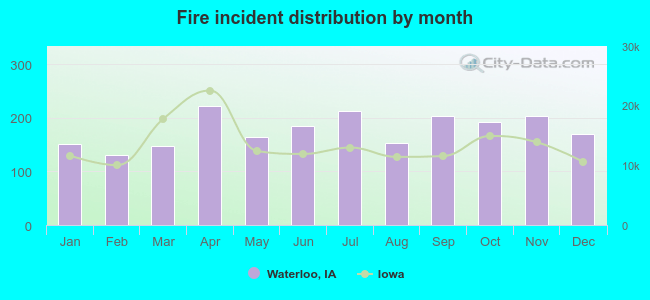 According to the 2,137 reports from years 2002 - 2018 most fires (10.4%) took place during April, and the least (6.1%) in February.
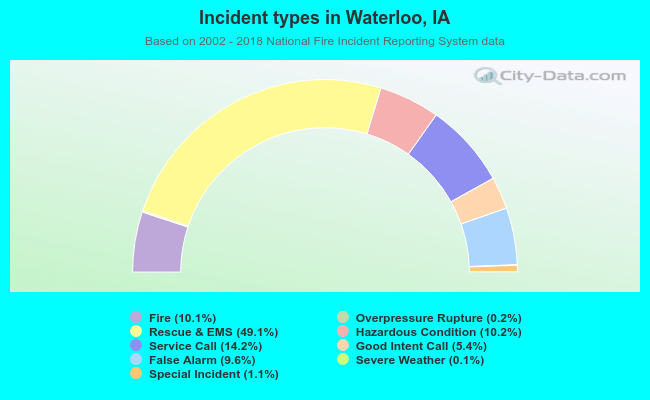 Out of all 21,166 cases reported during the years 2002 - 2018, the most belonged to the categories: Rescue & EMS (49.1%), Service Call (14.2%), and Hazardous Condition (10.2%).
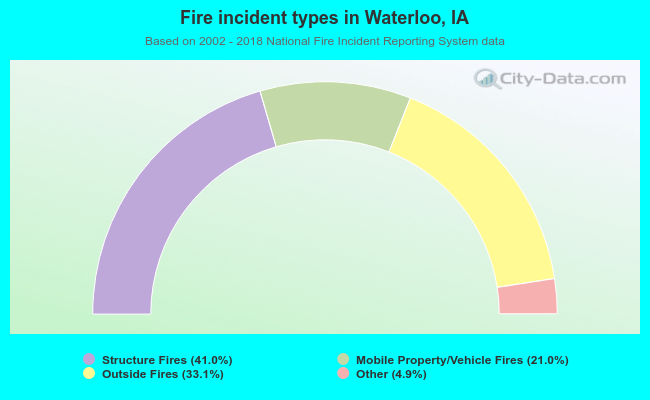 When looking into fire subcategories, the most incidents belonged to: Structure Fires (41.0%), and Outside Fires (33.1%).