Waverly: Fire Incidents, Iowa (IA)
Where are fire incidents reported in Waverly, IA
Something went wrong! Please refresh the page.
|
| |||||||||||||||||||||||||||||||||||||||||||||||||||||||||||||||||||||||||||||||||||||||||||||||||||||||||||||
2002 - 2016 National Fire Incident Reporting System (NFIRS) incidents
- Incident types reported to NFIRS in Waverly, IA
- 36649.6%Fire
- 18625.2%Hazardous Condition
- 8511.5%Good Intent Call
- 456.1%False Alarm
- 385.1%Rescue & EMS
- 141.9%Service Call
- 20.3%Severe Weather
- 10.1%Overpressure Rupture
- 10.1%Special Incident
- Fire incident types reported to NFIRS in Waverly, IA
- 13536.9%Outside Fires
- 13135.8%Structure Fires
- 7319.9%Mobile Property/Vehicle Fires
- 277.4%Other
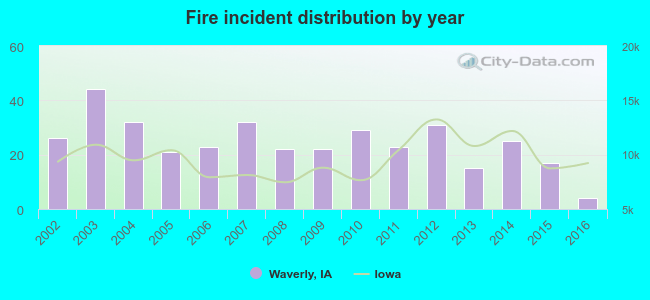 According to the data from the years 2002 - 2016 the average number of fire incidents per year is 24. The highest number of reported fire incidents - 44 took place in 2003, and the least - 4 in 2016. The data has a dropping trend.
The average number of yearly fire incidents per 10k residents in Waverly, IA compared to nearest cities:
(Note: Based on data for the last 3 years, including only cities with population 5,000 and above)
| Waverly: | 4.0 |
| Cedar Falls: | 6.9 |
| Waterloo: | 30.0 |
| Charles City: | 39.5 |
| Oelwein: | 54.2 |
| Independence: | 18.9 |
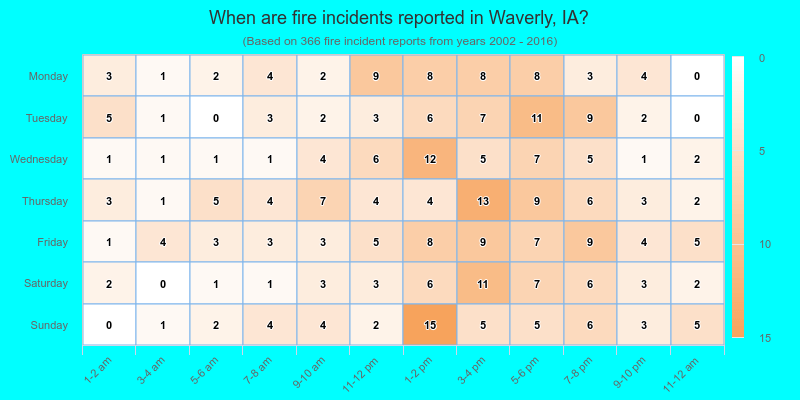
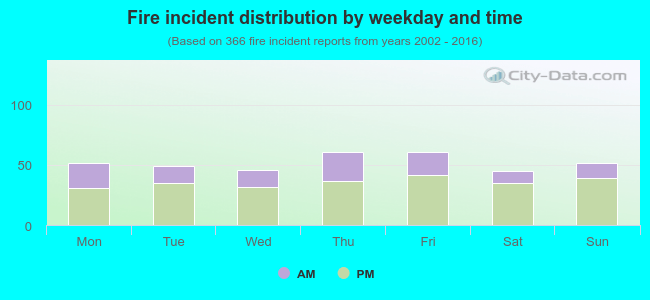 31.4% incidents where reported in the morning and 68.6% in the evening. The most fires (16.7%) took place on Thursday, and the least (12.3%) on Saturday.
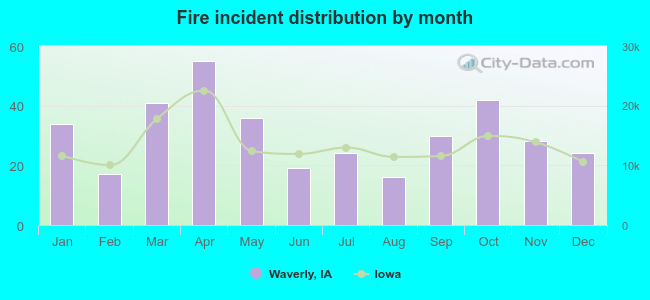 Based on the 366 fire incidents from years 2002 - 2016 most fires (15.0%) took place during April, and the least (4.4%) in August.
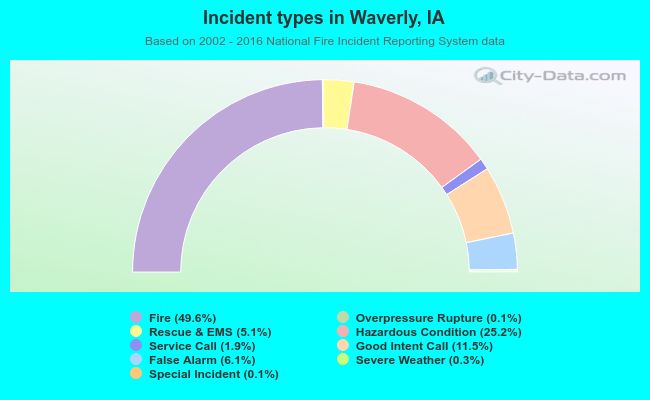 Out of all 738 cases reported during the years 2002 - 2016, the most belonged to the categories: Fire (49.6%), Hazardous Condition (25.2%), and Good Intent Call (11.5%).
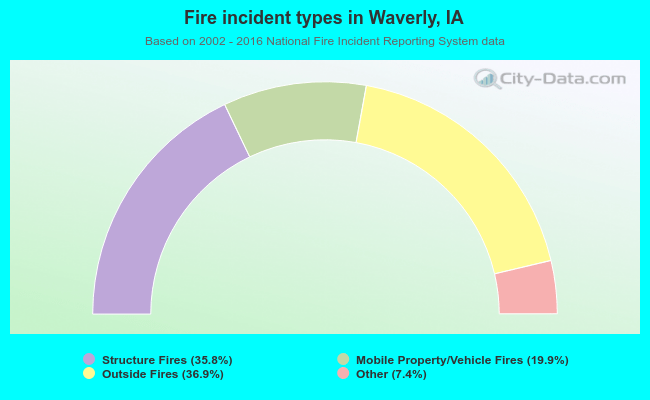 When looking into fire subcategories, the most incidents belonged to: Outside Fires (36.9%), and Structure Fires (35.8%).