West Haven: Fire Incidents, Connecticut (CT)
Where are fire incidents reported in West Haven, CT
Something went wrong! Please refresh the page.
| Fire incidents reported | |
|---|---|
| Sreet name | Count |
| CAMPBELL AVE | 470 |
| CAMPBELL AVE | 334 |
| ELM ST | 218 |
| MAIN ST | 214 |
| ELM ST | 206 |
| BOSTON POST RD | 186 |
| OAK ST | 164 |
| GLADE ST | 156 |
| BOSTON POST RD | 140 |
| CENTER ST | 136 |
| OAK ST | 134 |
| CENTER ST | 126 |
| MAIN ST | 124 |
| SAVIN AVE | 122 |
| FIRST AVE | 118 |
| COLEMAN ST | 104 |
| SAVIN AVE | 98 |
| SAW MILL RD | 96 |
| TERRACE AVE | 94 |
| WASHINGTON AVE | 88 |
| GRETA ST | 86 |
| HIGHLAND ST | 80 |
| FIRST AVE | 78 |
| TERRACE AVE | 78 |
| BLOHM ST | 74 |
| WASHINGTON AVE | 74 |
| BULL HILL LN | 72 |
| BULL HILL LN | 72 |
| COLEMAN ST | 68 |
| GLADE ST | 66 |
| Other | 1,532 |
2002 - 2018 National Fire Incident Reporting System (NFIRS) incidents
- Incident types reported to NFIRS in West Haven, CT
- 37,45558.6%Rescue & EMS
- 8,26512.9%Service Call
- 5,6088.8%Fire
- 4,4016.9%False Alarm
- 4,2586.7%Hazardous Condition
- 3,8246.0%Good Intent Call
- 750.1%Overpressure Rupture
- Fire incident types reported to NFIRS in West Haven, CT
- 3,56363.5%Structure Fires
- 1,27322.7%Outside Fires
- 57510.3%Mobile Property/Vehicle Fires
- 1973.5%Other
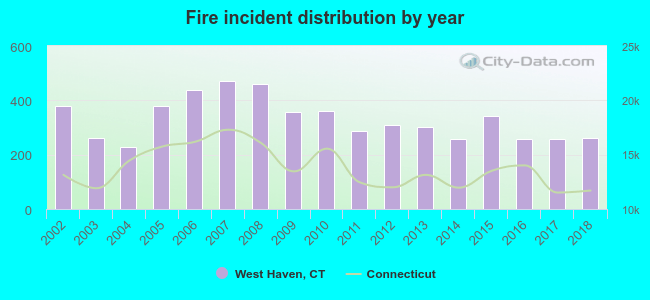 Based on the data from the years 2002 - 2018 the average number of fire incidents per year is 330. The highest number of fire incidents - 471 took place in 2007, and the least - 227 in 2004. The data has a declining trend.
The average number of yearly fire incidents per 10k residents in West Haven, CT compared to nearest cities:
(Note: Based on data for the last 3 years, including only cities with population 5,000 and above)
| West Haven: | 47.2 |
| Orange: | 34.2 |
| New Haven: | 29.0 |
| East Haven: | 30.2 |
| Woodbridge: | 51.2 |
| Milford: | 21.3 |
| Derby: | 47.0 |
| Hamden: | 29.3 |
| Ansonia: | 49.2 |
 The median response time based on all reported fire incidents is 4 minutes. This is lower than the state median value.
The median response time in West Haven, CT compared to nearest cities:
(Note: Based on data for all years, including only cities with at least 500 fire incidents)
| West Haven: | 4 minutes |
| Orange: | 5 minutes |
| New Haven: | 4 minutes |
| East Haven: | 4 minutes |
| Milford: | 5 minutes |
| Derby: | 3 minutes |
| Hamden: | 4 minutes |
| Ansonia: | 4 minutes |
| Branford: | 5 minutes |
 Based on the reports from the years 2002 - 2018 the average number of fire-related fatalities per year is 1. The highest number of reported deaths - 3 took place in 2014, and the lowest - 0 in 2006. The data has a decreasing trend.
The average number of fatalities per 1,000 fires is 3. This indicator was the highest - 12 in 2014, and the lowest 0 in 2006. The trend for deaths per 1,000 fires is dropping. Compared to the state value the number of fatalities per 1,000 fire incidents is higher.
Based on the reports from the years 2002 - 2018 the average number of fire-related fatalities per year is 1. The highest number of reported deaths - 3 took place in 2014, and the lowest - 0 in 2006. The data has a decreasing trend.
The average number of fatalities per 1,000 fires is 3. This indicator was the highest - 12 in 2014, and the lowest 0 in 2006. The trend for deaths per 1,000 fires is dropping. Compared to the state value the number of fatalities per 1,000 fire incidents is higher.Deaths per 1,000 incidents in West Haven, CT compared to nearest cities:
(Note: Based on data for all years, including only cities with at least 2,500 fire incidents)
| West Haven: | 2.1 |
| New Haven: | 1.6 |
| Hamden: | 2.1 |
| Stratford: | 2.7 |
| Bridgeport: | 2.5 |
| Wallingford: | 2.2 |
| Fairfield: | 4.0 |
| Meriden: | 1.6 |
| Waterbury: | 0.7 |
 According to the data from the years 2002 - 2018 the average number of fire-related casualties per year is 4. The highest number of casualties - 11 took place in 2002, and the lowest - 0 in 2012. The data has a decreasing trend.
The average number of casualties per 1,000 fire incidents is 15. This indicator was the highest - 44 in 2004, and the lowest 0 in 2012. The trend for injuries per 1,000 incidents is declining. Compared to the Connecticut value the number of injuries per 1,000 fires is about the same.
According to the data from the years 2002 - 2018 the average number of fire-related casualties per year is 4. The highest number of casualties - 11 took place in 2002, and the lowest - 0 in 2012. The data has a decreasing trend.
The average number of casualties per 1,000 fire incidents is 15. This indicator was the highest - 44 in 2004, and the lowest 0 in 2012. The trend for injuries per 1,000 incidents is declining. Compared to the Connecticut value the number of injuries per 1,000 fires is about the same.
 29.8% incidents where reported in the morning and 70.2% in the evening. The most fires (15.7%) took place on Saturday, and the least (13.6%) on Tuesday.
 Based on the 5,608 fire incident reports from years 2002 - 2018 most fires (9.5%) took place during April, and the least (7.4%) in September.
 Out of all 63,954 cases reported during the years 2002 - 2018, the most belonged to the categories: Rescue & EMS (58.6%), Service Call (12.9%), and Fire (8.8%).
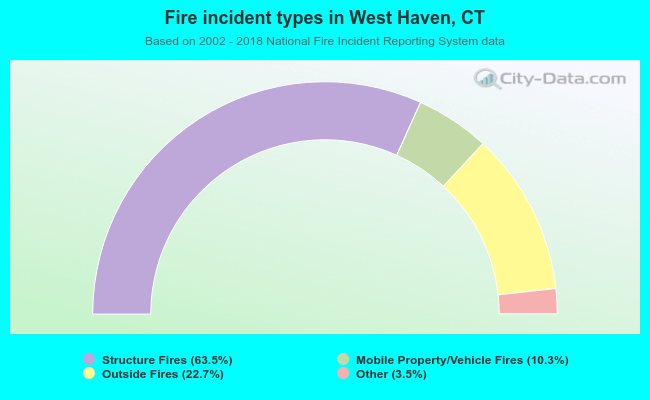 When looking into fire subcategories, the most reports belonged to: Structure Fires (63.5%), and Outside Fires (22.7%).