Stratford: Fire Incidents, Connecticut (CT)
Where are fire incidents reported in Stratford, CT
Something went wrong! Please refresh the page.
| Fire incidents reported | |
|---|---|
| Sreet name | Count |
| MAIN ST | 140 |
| MAIN ST | 104 |
| BARNUM AVENUE | 92 |
| MAIN STREET | 90 |
| BROADBRIDGE AVE | 64 |
| BARNUM AVE | 60 |
| FERRY BLVD | 44 |
| HUNTINGTON RD | 42 |
| FERRY BLVD | 38 |
| BROADBRIDGE AV | 36 |
| LORDSHIP BLVD | 32 |
| STRATFORD AVE | 32 |
| STRATFORD AVENUE | 32 |
| BARNUM AVE CUTOFF | 28 |
| BIRDSEYE ST | 28 |
| HOLLISTER ST | 28 |
| HUNTINGTON RD | 28 |
| WOODEND RD | 28 |
| BARNUM AVENUE CUTOFF | 26 |
| BROAD ST | 26 |
| BARNUM AV | 24 |
| EAST MAIN ST | 24 |
| HOLLISTER ST | 24 |
| HONEYSPOT RD | 24 |
| NICHOLS AVENUE | 24 |
| RT 15 | 24 |
| STRATFORD AV | 24 |
| HOLLISTER STREET | 22 |
| HONEYSPOT RD | 22 |
| LORDSHIP BLVD | 22 |
| Other | 1,346 |
2002 - 2018 National Fire Incident Reporting System (NFIRS) incidents
- Incident types reported to NFIRS in Stratford, CT
- 21,33861.0%Rescue & EMS
- 3,87211.1%Hazardous Condition
- 2,9108.3%False Alarm
- 2,6167.5%Service Call
- 2,5787.4%Fire
- 1,4574.2%Good Intent Call
- 1060.3%Overpressure Rupture
- 880.3%Special Incident
- Fire incident types reported to NFIRS in Stratford, CT
- 1,04240.4%Structure Fires
- 93336.2%Outside Fires
- 44517.3%Mobile Property/Vehicle Fires
- 1586.1%Other
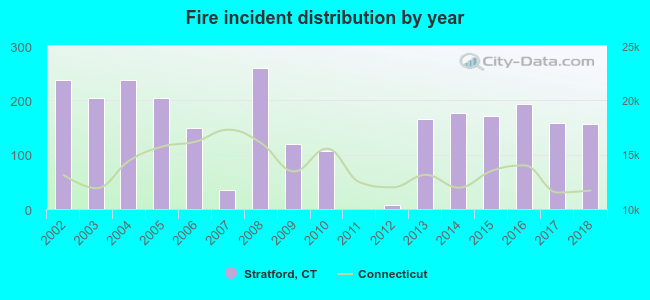 Based on the data from the years 2002 - 2018 the average number of fires per year is 152. The highest number of reported fires - 259 took place in 2008, and the least - 0 in 2011. The data has a decreasing trend.
The average number of yearly fire incidents per 10k residents in Stratford, CT compared to nearest cities:
(Note: Based on data for the last 3 years, including only cities with population 5,000 and above)
| Stratford: | 32.9 |
| Bridgeport: | 30.2 |
| Milford: | 21.3 |
| Trumbull: | 36.1 |
| Fairfield: | 22.6 |
| Shelton: | 16.1 |
| Orange: | 34.2 |
| Derby: | 47.0 |
| Easton: | 34.3 |
 The median response time based on all reported fire incidents is 5 minutes. This is similar to the Connecticut median value.
The median response time in Stratford, CT compared to nearest cities:
(Note: Based on data for all years, including only cities with at least 500 fire incidents)
| Stratford: | 5 minutes |
| Bridgeport: | 4 minutes |
| Milford: | 5 minutes |
| Trumbull: | 6 minutes |
| Fairfield: | 6 minutes |
| Shelton: | 7 minutes |
| Orange: | 5 minutes |
| Derby: | 3 minutes |
| West Haven: | 4 minutes |
 Based on the reports from the years 2002 - 2018 the average number of fire-related yearly deaths is 0. The highest number of deaths - 3 took place in 2009, and the lowest - 0 in 2004. The data has a constant trend.
The average number of deaths per 1,000 fires is 3. This indicator was the highest - 25 in 2009, and the lowest 0 in 2004. The trend for fatalities per 1,000 fires is increasing. Compared to the Connecticut value the number of deaths per 1,000 fire incidents is higher.
Based on the reports from the years 2002 - 2018 the average number of fire-related yearly deaths is 0. The highest number of deaths - 3 took place in 2009, and the lowest - 0 in 2004. The data has a constant trend.
The average number of deaths per 1,000 fires is 3. This indicator was the highest - 25 in 2009, and the lowest 0 in 2004. The trend for fatalities per 1,000 fires is increasing. Compared to the Connecticut value the number of deaths per 1,000 fire incidents is higher.Deaths per 1,000 incidents in Stratford, CT compared to nearest cities:
(Note: Based on data for all years, including only cities with at least 2,500 fire incidents)
| Stratford: | 2.7 |
| Bridgeport: | 2.5 |
| Fairfield: | 4.0 |
| West Haven: | 2.1 |
| New Haven: | 1.6 |
| Hamden: | 2.1 |
| Norwalk: | 2.0 |
| Danbury: | 1.7 |
| Stamford: | 1.3 |
 Based on the reports from the years 2002 - 2018 the average number of fire-related casualties per year is 2. The highest number of injuries - 10 took place in 2018, and the lowest - 0 in 2003. The data has a rising trend.
The average number of injuries per 1,000 fires is 9. This indicator was the highest - 64 in 2018, and the lowest 0 in 2003. The trend for injuries per 1,000 incidents is growing. Compared to the state value the number of injuries per 1,000 incidents is about the same.
Based on the reports from the years 2002 - 2018 the average number of fire-related casualties per year is 2. The highest number of injuries - 10 took place in 2018, and the lowest - 0 in 2003. The data has a rising trend.
The average number of injuries per 1,000 fires is 9. This indicator was the highest - 64 in 2018, and the lowest 0 in 2003. The trend for injuries per 1,000 incidents is growing. Compared to the state value the number of injuries per 1,000 incidents is about the same.Casualties per 1,000 incidents in Stratford, CT compared to nearest cities:
(Note: Based on data for all years, including only cities with at least 500 fire incidents)
| Stratford: | 10.5 |
| Bridgeport: | 14.2 |
| Milford: | 13.2 |
| Trumbull: | 3.0 |
| Fairfield: | 21.6 |
| Shelton: | 21.4 |
| Orange: | 14.3 |
| Derby: | 15.3 |
| West Haven: | 13.6 |
 28.0% incidents where reported in the morning and 72.0% in the evening. The most fires (16.3%) took place on Saturday, and the least (12.8%) on Friday.
 Based on the 2,578 fire incident reports from years 2002 - 2018 most fires (10.4%) took place during August, and the least (6.4%) in February.
 Out of all 34,985 cases reported during the years 2002 - 2018, the most belonged to the categories: Rescue & EMS (61.0%), Hazardous Condition (11.1%), and False Alarm (8.3%).
 When looking into fire subcategories, the most reports belonged to: Structure Fires (40.4%), and Outside Fires (36.2%).