West Palm Beach: Fire Incidents, Florida (FL)
Where are fire incidents reported in West Palm Beach, FL
Something went wrong! Please refresh the page.
| Fire incidents reported | |
|---|---|
| Sreet name | Count |
| OKEECHOBEE BLVD | 328 |
| 45TH ST | 304 |
| FLAGLER DR | 300 |
| PALM BEACH LAKES BLVD | 300 |
| CONGRESS AVE | 296 |
| DIXIE HWY | 224 |
| HAVERHILL RD | 222 |
| AUSTRALIAN AVE | 210 |
| JOG RD | 188 |
| INTERSTATE 95 | 186 |
| BELVEDERE RD | 168 |
| EXECUTIVE CENTER DR | 168 |
| MILITARY TRL | 150 |
| VILLAGE BLVD | 128 |
| FOREST HILL BLVD | 126 |
| SOUTHERN BLVD | 118 |
| PARKER AVE | 90 |
| OLIVE AVE | 76 |
| CLEMATIS ST | 74 |
| GEORGIA AVE | 72 |
| PINEWOOD AVE | 72 |
| BRANDYWINE RD | 66 |
| TAMARIND AVE | 66 |
| CARIBBEAN BLVD | 60 |
| BROADWAY | 58 |
| PORTOFINO WAY | 58 |
| ROSEMARY AVE | 58 |
| BENOIST FARMS RD | 56 |
| 8TH ST | 54 |
| 36TH ST | 52 |
| Other | 1,794 |
2003 - 2018 National Fire Incident Reporting System (NFIRS) incidents
- Incident types reported to NFIRS in West Palm Beach, FL
- 88,75271.7%Rescue & EMS
- 10,2298.3%False Alarm
- 9,1937.4%Good Intent Call
- 6,1224.9%Fire
- 4,7443.8%Service Call
- 4,5223.7%Hazardous Condition
- 1410.1%Overpressure Rupture
- Fire incident types reported to NFIRS in West Palm Beach, FL
- 2,40139.2%Structure Fires
- 2,24436.7%Outside Fires
- 1,38222.6%Mobile Property/Vehicle Fires
- 951.6%Other
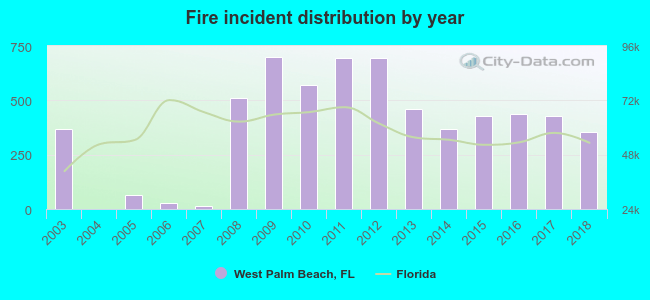 According to the data from the years 2003 - 2018 the average number of fire incidents per year is 383. The highest number of reported fire incidents - 700 took place in 2009, and the least - 1 in 2004. The data has a decreasing trend.
The average number of yearly fire incidents per 10k residents in West Palm Beach, FL compared to nearest cities:
(Note: Based on data for the last 3 years, including only cities with population 5,000 and above)
| West Palm Beach: | 39.1 |
| Palm Beach: | 41.6 |
| Riviera Beach: | 39.6 |
| Palm Springs: | 22.6 |
| Lake Park: | 47.7 |
| Lake Worth: | 28.6 |
| Greenacres: | 14.3 |
| North Palm Beach: | 17.1 |
| Palm Beach Gardens: | 2.0 |
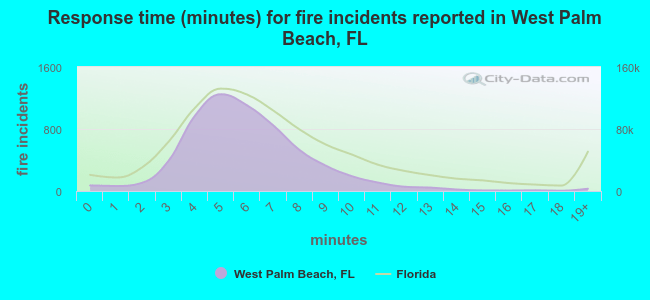 The median response time based on all reported fire incidents is 6 minutes. This is about the same as the Florida median value.
The median response time in West Palm Beach, FL compared to nearest cities:
(Note: Based on data for all years, including only cities with at least 500 fire incidents)
| West Palm Beach: | 6 minutes |
| Riviera Beach: | 5 minutes |
| Lake Worth: | 6 minutes |
| Greenacres: | 5 minutes |
| North Palm Beach: | 5 minutes |
| Palm Beach Gardens: | 6 minutes |
| Wellington: | 7 minutes |
| Boynton Beach: | 5 minutes |
| Jupiter: | 7 minutes |
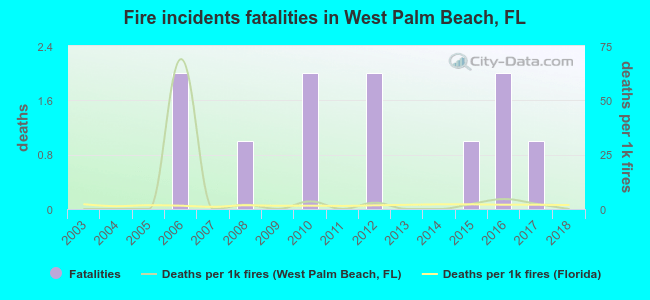 Based on the reports from the years 2003 - 2018 the average number of fire-related yearly deaths is 1. The highest number of reported deaths - 2 took place in 2006, and the lowest - 0 in 2003. The data has a constant trend.
The average number of deaths per 1,000 fire incidents is 5. This indicator was the highest - 69 in 2006, and the lowest 0 in 2003. The trend for deaths per 1,000 fires is rising. Compared to the state value the number of fatalities per 1,000 incidents is similar.
Based on the reports from the years 2003 - 2018 the average number of fire-related yearly deaths is 1. The highest number of reported deaths - 2 took place in 2006, and the lowest - 0 in 2003. The data has a constant trend.
The average number of deaths per 1,000 fire incidents is 5. This indicator was the highest - 69 in 2006, and the lowest 0 in 2003. The trend for deaths per 1,000 fires is rising. Compared to the state value the number of fatalities per 1,000 incidents is similar.Deaths per 1,000 incidents in West Palm Beach, FL compared to nearest cities:
(Note: Based on data for all years, including only cities with at least 2,500 fire incidents)
| West Palm Beach: | 1.8 |
| Lake Worth: | 1.6 |
| Boynton Beach: | 0.4 |
| Boca Raton: | 0.3 |
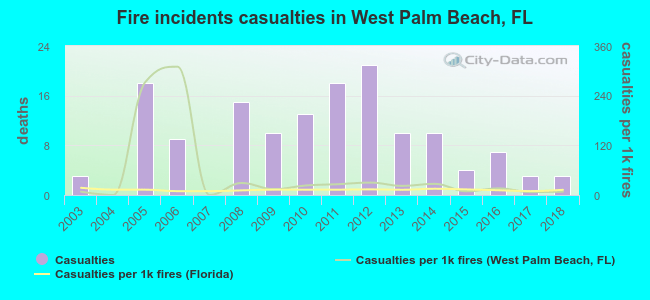 Based on the reports from the years 2003 - 2018 the average number of fire-related yearly casualties is 9. The highest number of casualties - 21 took place in 2012, and the lowest - 0 in 2004. The data has a constant trend.
The average number of injuries per 1,000 fires is 50. This indicator was the highest - 310 in 2006, and the lowest 0 in 2004. The trend for injuries per 1,000 fires is constant. Compared to the Florida value the number of injuries per 1,000 incidents is higher.
Based on the reports from the years 2003 - 2018 the average number of fire-related yearly casualties is 9. The highest number of casualties - 21 took place in 2012, and the lowest - 0 in 2004. The data has a constant trend.
The average number of injuries per 1,000 fires is 50. This indicator was the highest - 310 in 2006, and the lowest 0 in 2004. The trend for injuries per 1,000 fires is constant. Compared to the Florida value the number of injuries per 1,000 incidents is higher.Casualties per 1,000 incidents in West Palm Beach, FL compared to nearest cities:
(Note: Based on data for all years, including only cities with at least 500 fire incidents)
| West Palm Beach: | 23.5 |
| Riviera Beach: | 50.2 |
| Lake Worth: | 38.4 |
| Greenacres: | 34.9 |
| North Palm Beach: | 33.8 |
| Palm Beach Gardens: | 4.4 |
| Wellington: | 29.8 |
| Boynton Beach: | 17.3 |
| Jupiter: | 23.9 |
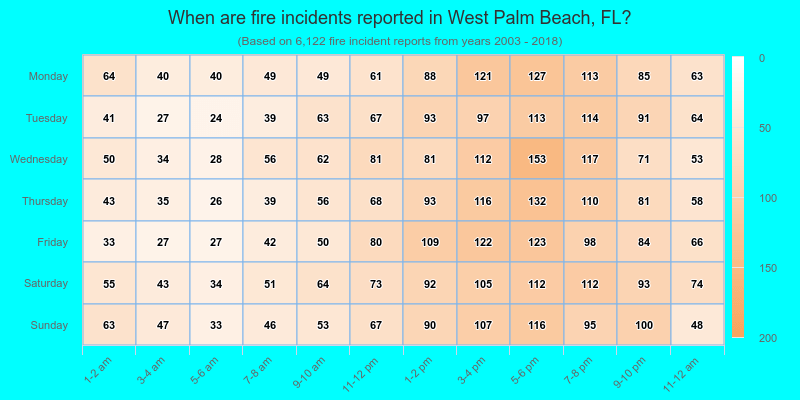
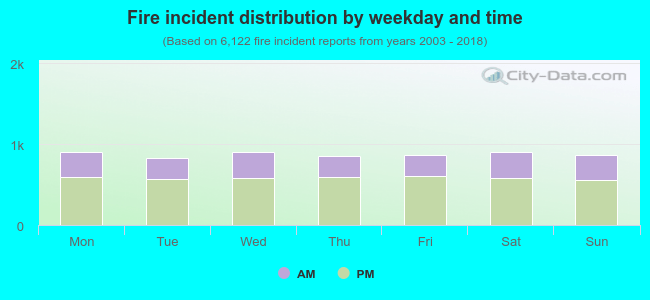 33.2% incidents where reported in the morning and 66.8% in the evening. The most fires (14.8%) took place on Saturday, and the least (13.6%) on Tuesday.
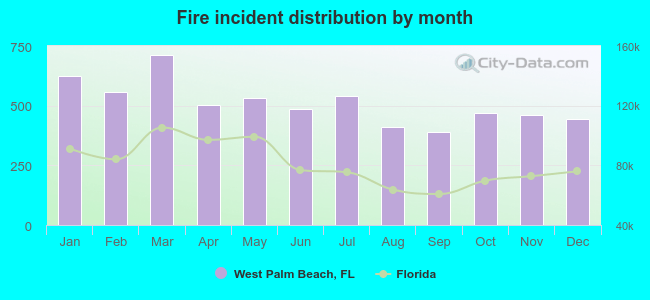 According to the 6,122 fire incidents from years 2003 - 2018 most fires (11.6%) took place during March, and the least (6.4%) in September.
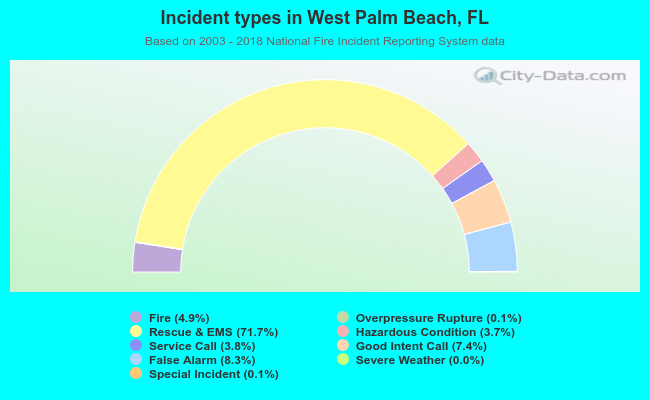 Out of all 123,790 cases reported during the years 2003 - 2018, the most belonged to the categories: Rescue & EMS (71.7%), False Alarm (8.3%), and Good Intent Call (7.4%).
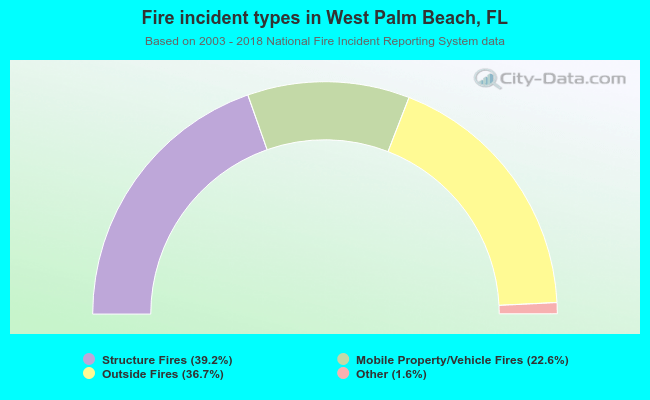 When looking into fire subcategories, the most incidents belonged to: Structure Fires (39.2%), and Outside Fires (36.7%).